Welcome to InsightFinder Docs!
Categories
Root Cause Analysis
Overview
InsightFinder’s Root Cause Analysis (RCA) is an AI-driven diagnostic engine designed to streamline incident management by moving beyond simple event correlation. Leveraging patented Unsupervised Behavior Learning and advanced Lag-time Modeling, the system automatically distinguishes true causal triggers from noise, offering users both rapid “Quick Look” previews and deep-dive interactive causal graphs. Beyond diagnosis, the platform provides intelligent Recommended Actions—prescriptive, data-backed steps that guide teams through remediation. By pinpointing failure origins with high precision and offering actionable guidance, InsightFinder empowers organizations to drastically reduce MTTR, eliminate alert fatigue, and shift from reactive firefighting to proactive, data-driven system management.
1. Feature Entry: From Anomaly to Insight
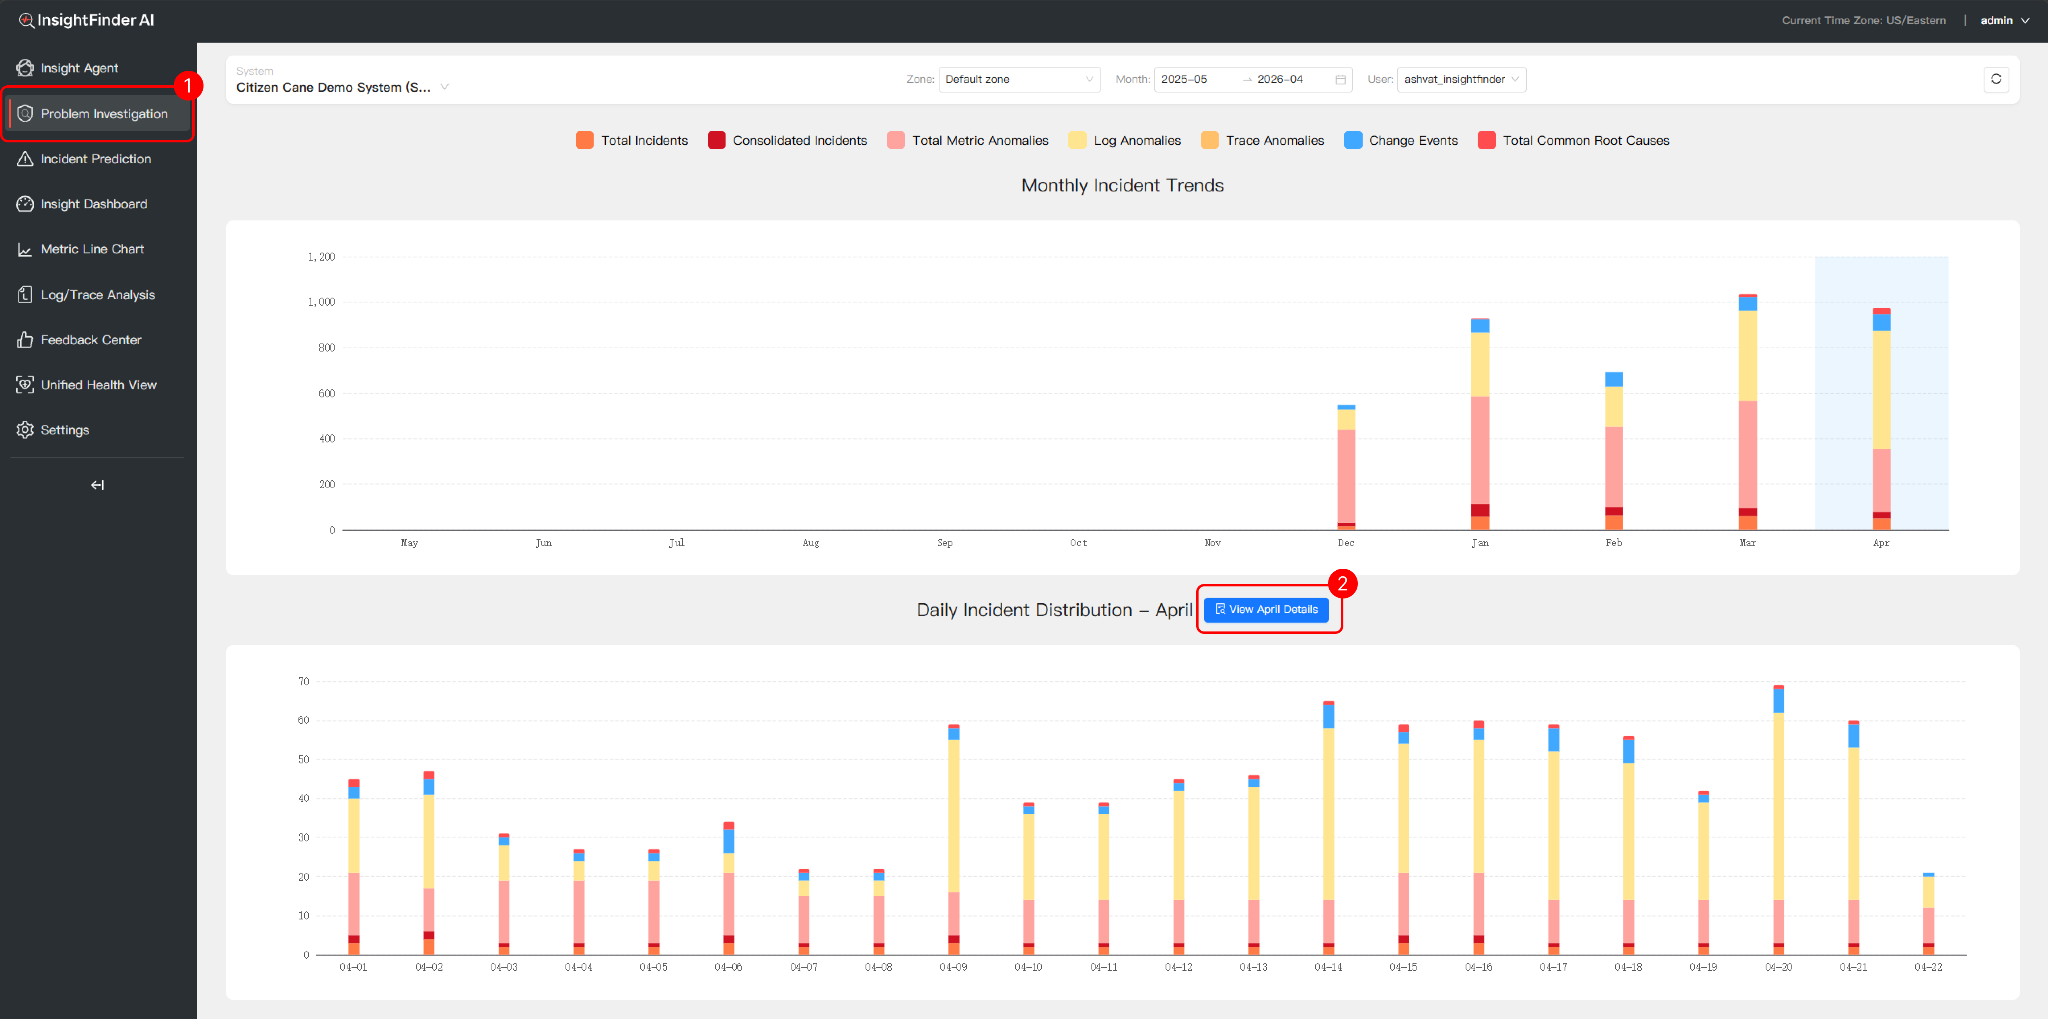
InsightFinder provides a seamless workflow in the Problem Investigation list to help users move from identifying a problem to understanding its origin:
- View Incident List:Navigate to “Problem Investigation”, select your time range, and click “View Details” to load the relevant incidents.
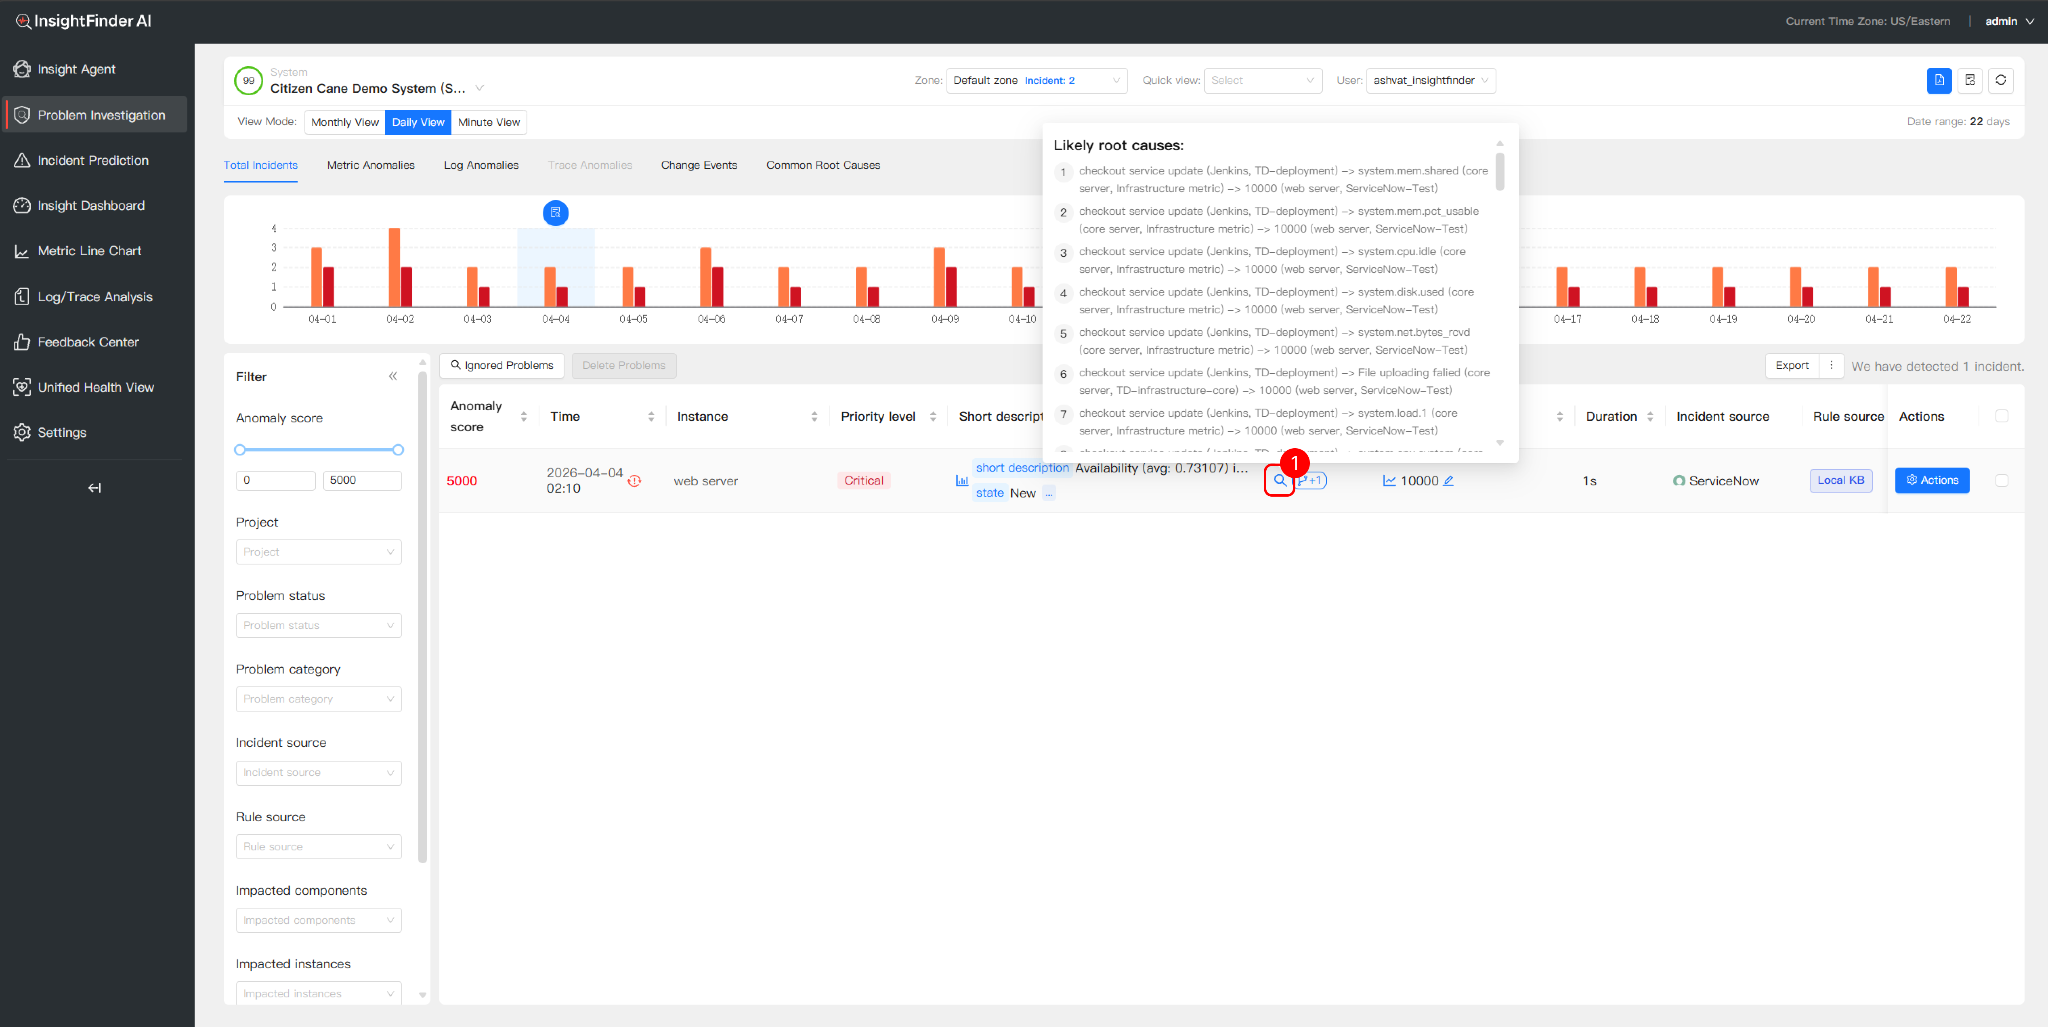
- Quick Insight:hover the active “RCA icon”(magnifying glass) on any incident to preview “Likely root causes” immediately.
- Deep Dive:Click “RCA icon” or the incident title to open the full RCA page for a comprehensive analysis.
2. Feature Description: AI-Driven Troubleshooting
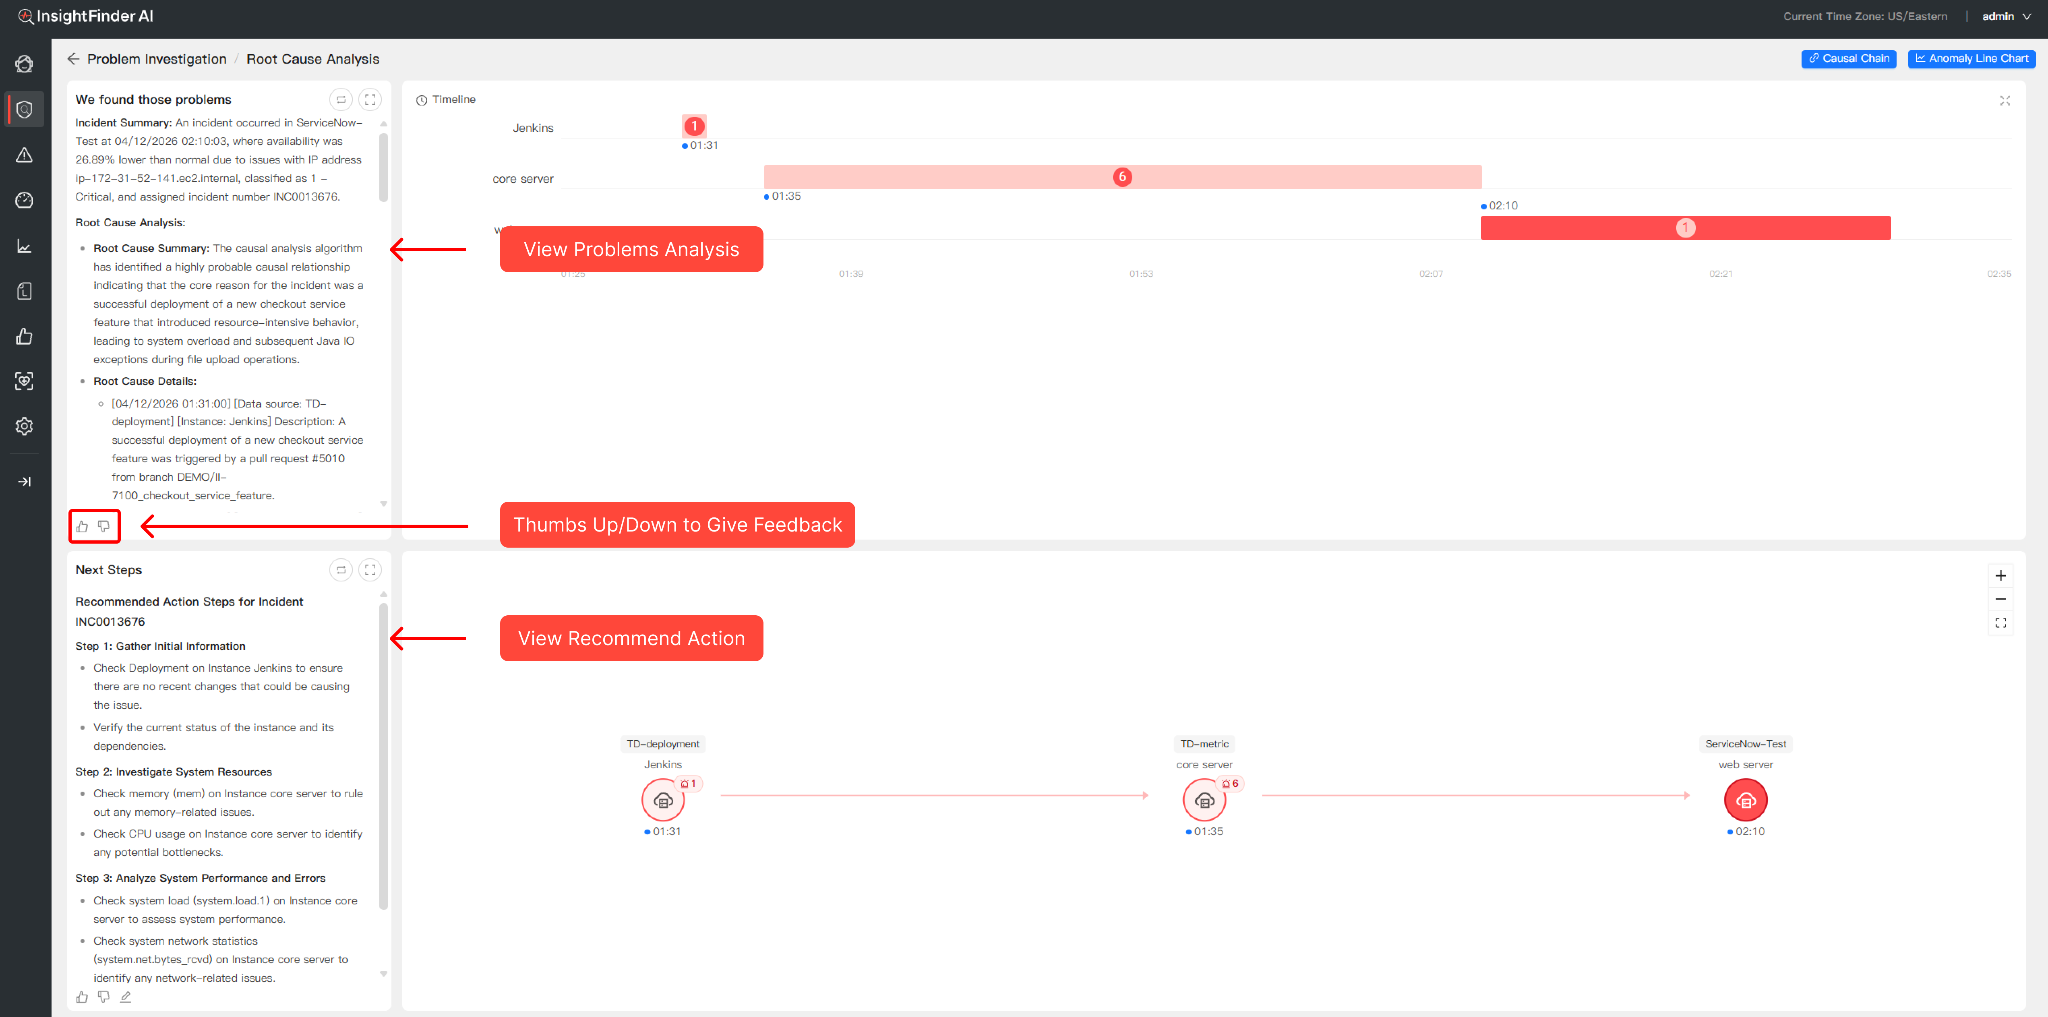
The RCA page utilizes patented Unsupervised Behavior Learning to transform raw data into a clear narrative, moving beyond mere correlation to true causality.
- Root Cause Summary:The system provides a natural language explanation of the failure. For example, it might identify that a code deployment on a specific instance led to resource-intensive behavior, which in turn caused a Java IOException and subsequent system instability.
- Recommended Actions (Next Steps):To reduce Mean Time to Repair (MTTR), the platform offers prescriptive steps. It guides you to check specific configurations, monitor system loads, or verify network activity on the exact instances identified as problematic.
- Feedback Loop (Thumbs Up/Down):Located within the RCA summary and action panels are “Thumbs Up” and “Thumbs Down” buttons. These are crucial for the support system; by providing feedback on the accuracy of the analysis, you directly train the underlying AI model to be more precise for your specific environment.
3. RCA and Causal Chain
The core of the investigation is the visual mapping of the failure’s propagation across your infrastructure.
3.1 Interactive Timeline & Causal Graph
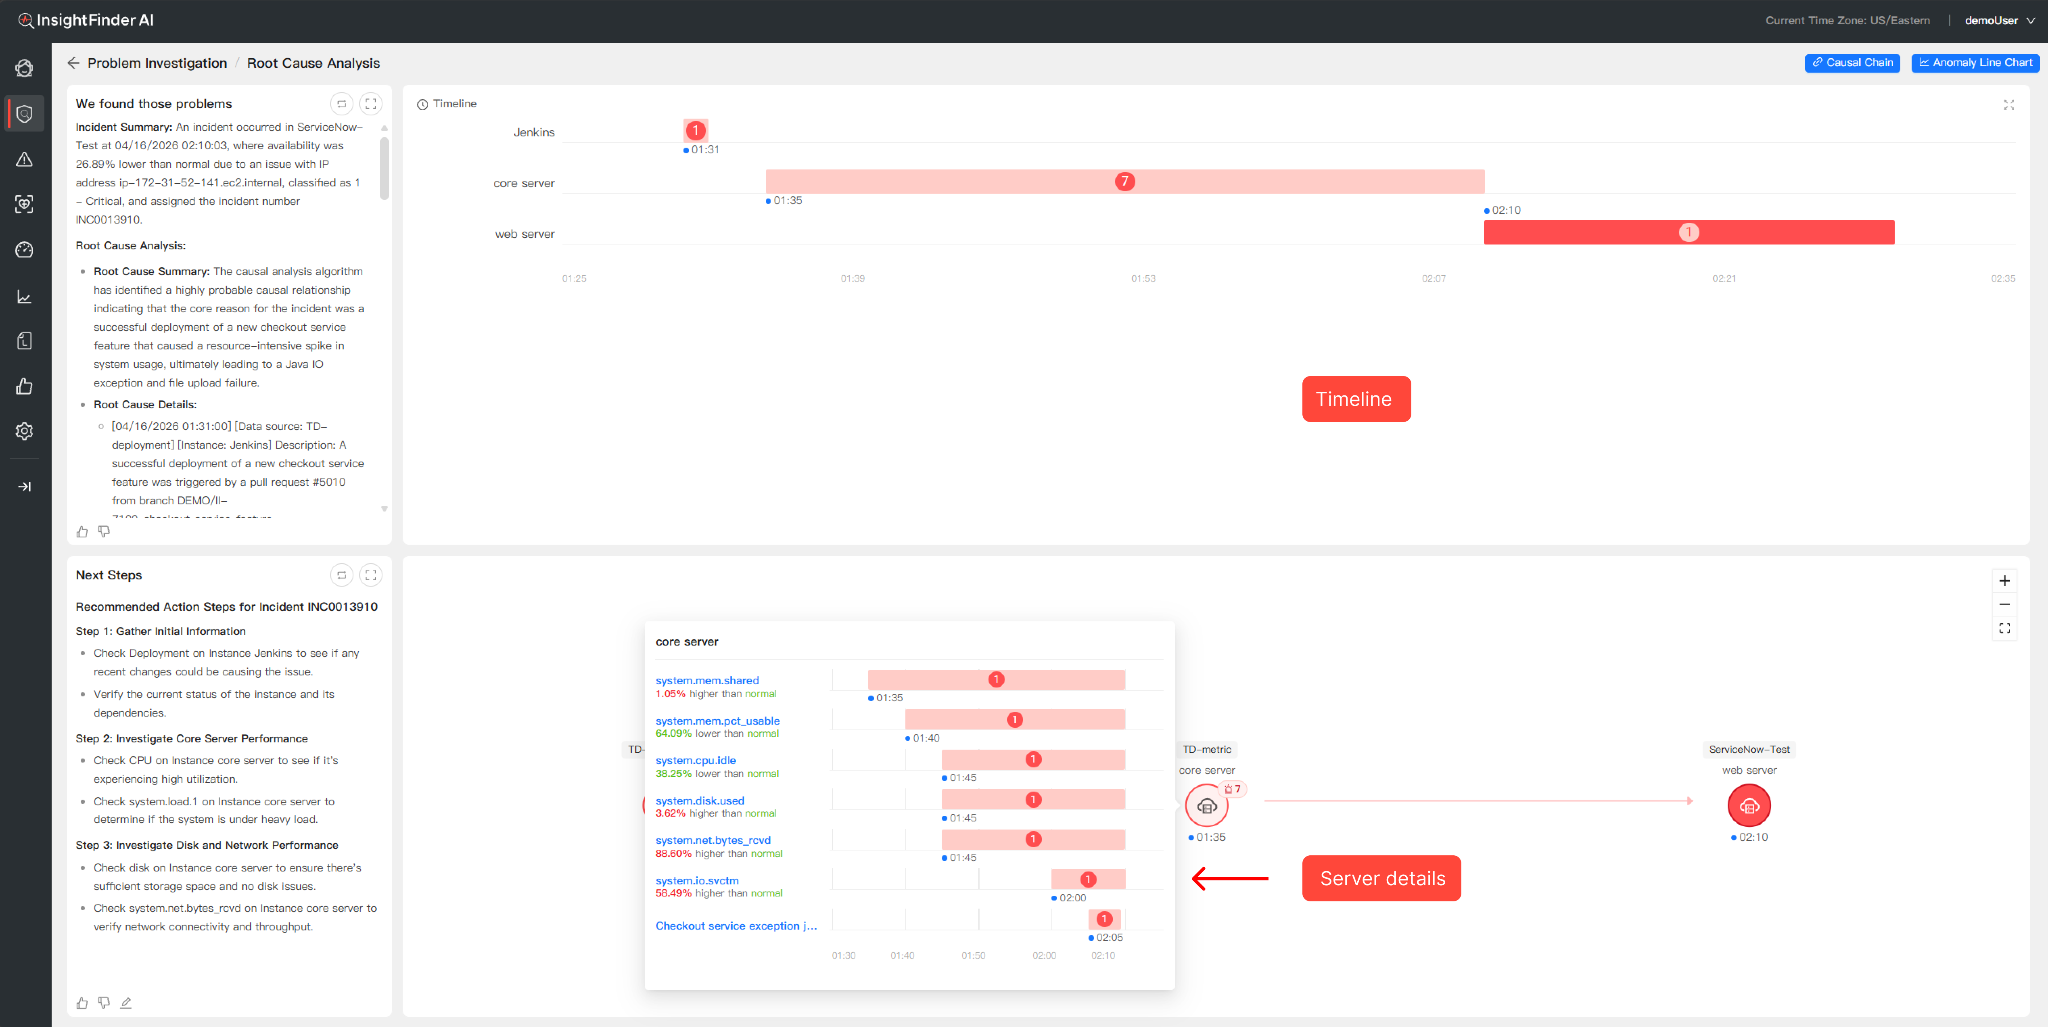
- Timeline:Displays the duration and overlap of anomalous behavior across different services, allowing you to see the temporal sequence of the anomaly.
- Interactive Causal Trees:The graph uses nodes and directed arrows to show the flow of impact. Clicking on a specific server node (e.g., Core Server) allows you to drill down into that server’s specific details. You can instantly see if the node suffered from memory exhaustion, CPU spikes, or specific log errors, pinpointing exactly what happened within that component.
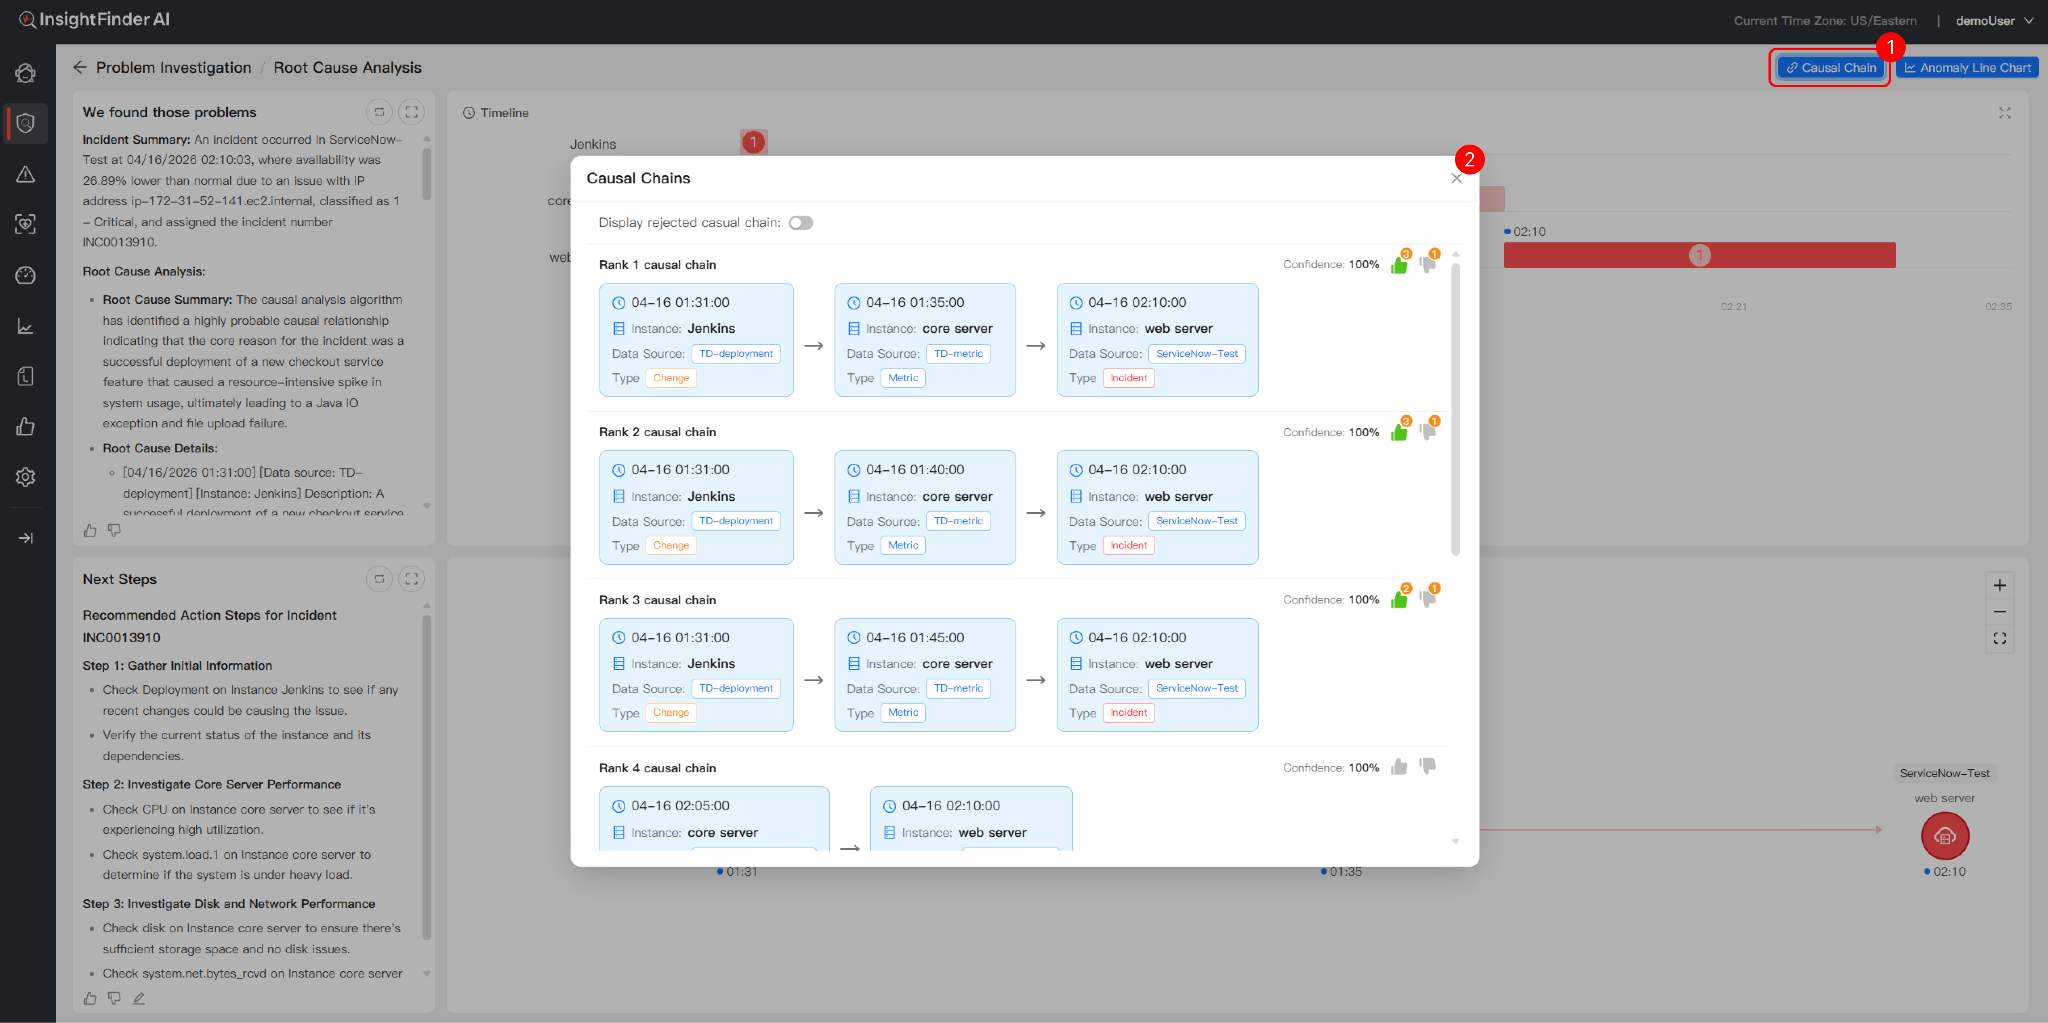
3.2 Ranked Causal Chains
To explore multiple failure hypotheses and understand the propagation of an incident, click the “Causal Chain” button in the top right corner of the Root Cause Analysis page. This action opens a modal window displaying the system’s generated causal paths:
- Prioritized Analysis:Chains are ranked by confidence levels, helping you quickly identify the most probable sequence of events that led to the incident.
- Comprehensive Traceability:Each step in the chain provides granular data—including timestamps, instance names, data sources, and event types (e.g., Change, Metric, Incident). This visual sequence maps exactly how an initial trigger (such as a Jenkins deployment) propagated through infrastructure metrics to cause the final user-facing error.
- Noise Reduction:Leveraging Lag-time Modeling, the system filters out unrelated, synchronous fluctuations to isolate the “true” causal signal.
- Feedback Loop:Each causal chain includes feedback controls (thumbs up/down). By rating these paths, you directly contribute to training the AI model, ensuring it becomes increasingly accurate for your specific environment.
From the Blog


See how InsightFinder helps your team deliver reliable services across every layer of the stack
Take InsightFinder AI for a no-obligation test drive. We’ll provide you with a detailed report on your outages to uncover what could have been prevented.
