Welcome to InsightFinder Docs!
Categories
Insights Dashboard
The Insights Dashboard is a highly customizable operational environment for real-time monitoring and predictive analysis. It offers a “Build-Your-Own” experience, enabling users to curate widgets across three intelligence categories: Graphs (AI-powered diagnostics), Cost Project Graphs (financial governance), and Kubernetes (cluster health). Based on comprehensive statistical calculations, it serves as a unified hub for tracking system health trends, incident patterns, and downtime/labor costs, while providing actionable metrics like prediction accuracy and alert suppression counts.
1. Dashboard Management & Creation
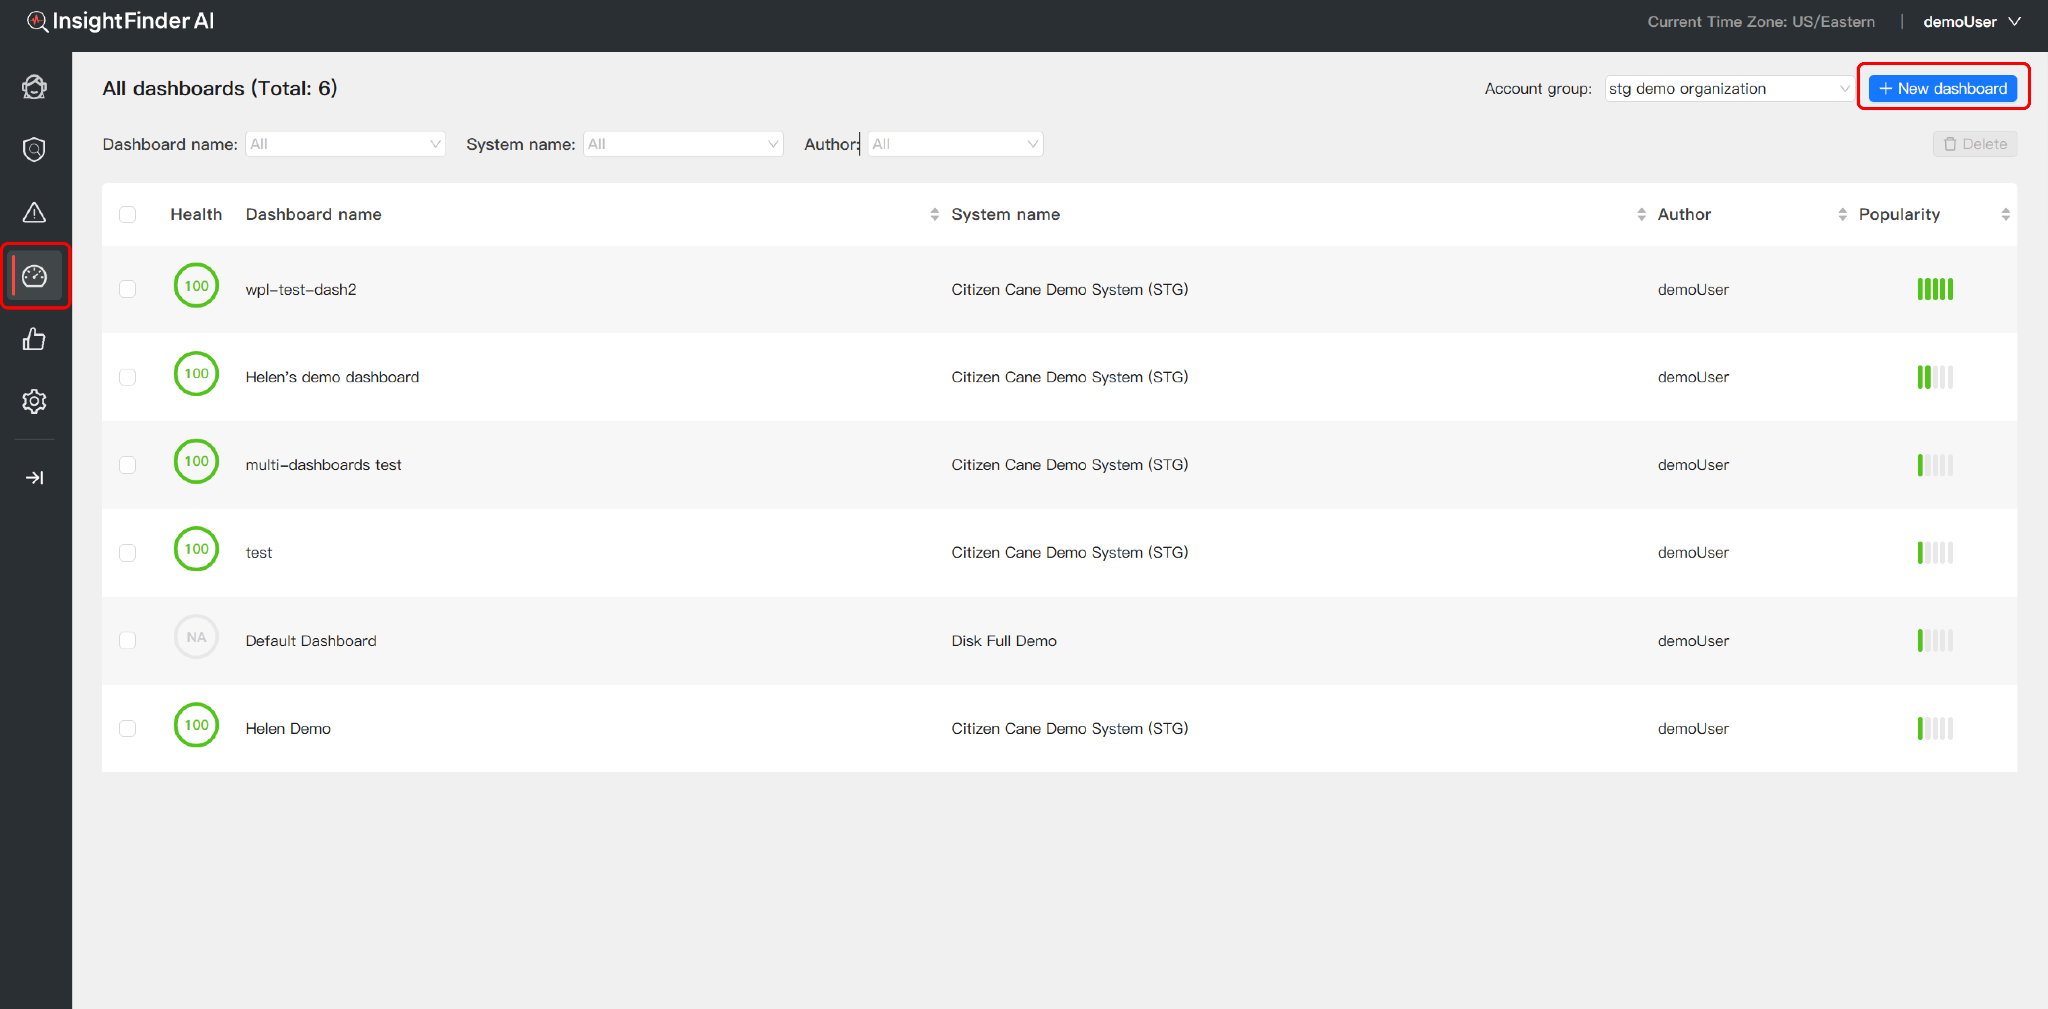
Navigate to the Insights Dashboards section.From the “All dashboards” landing page, users can oversee their entire monitoring ecosystem:
- Create New Dashboards:Click the “+ New dashboard” button to build a clean-slate view for specific systems or projects.
- System Health At-a-Glance:Track the real-time Health Score (0-100) and Popularity of each dashboard to prioritize critical environments.
- Search & Filter:Quickly locate specific views by Dashboard Name, System, or Author.
2. Dynamic Customization (Edit Mode)
Once inside a dashboard, users have full authority over the interface layout through an intuitive sidebar workflow:
- Enter Edit Mode:Click the Edit icon next to the dashboard name to unlock the customization layer.
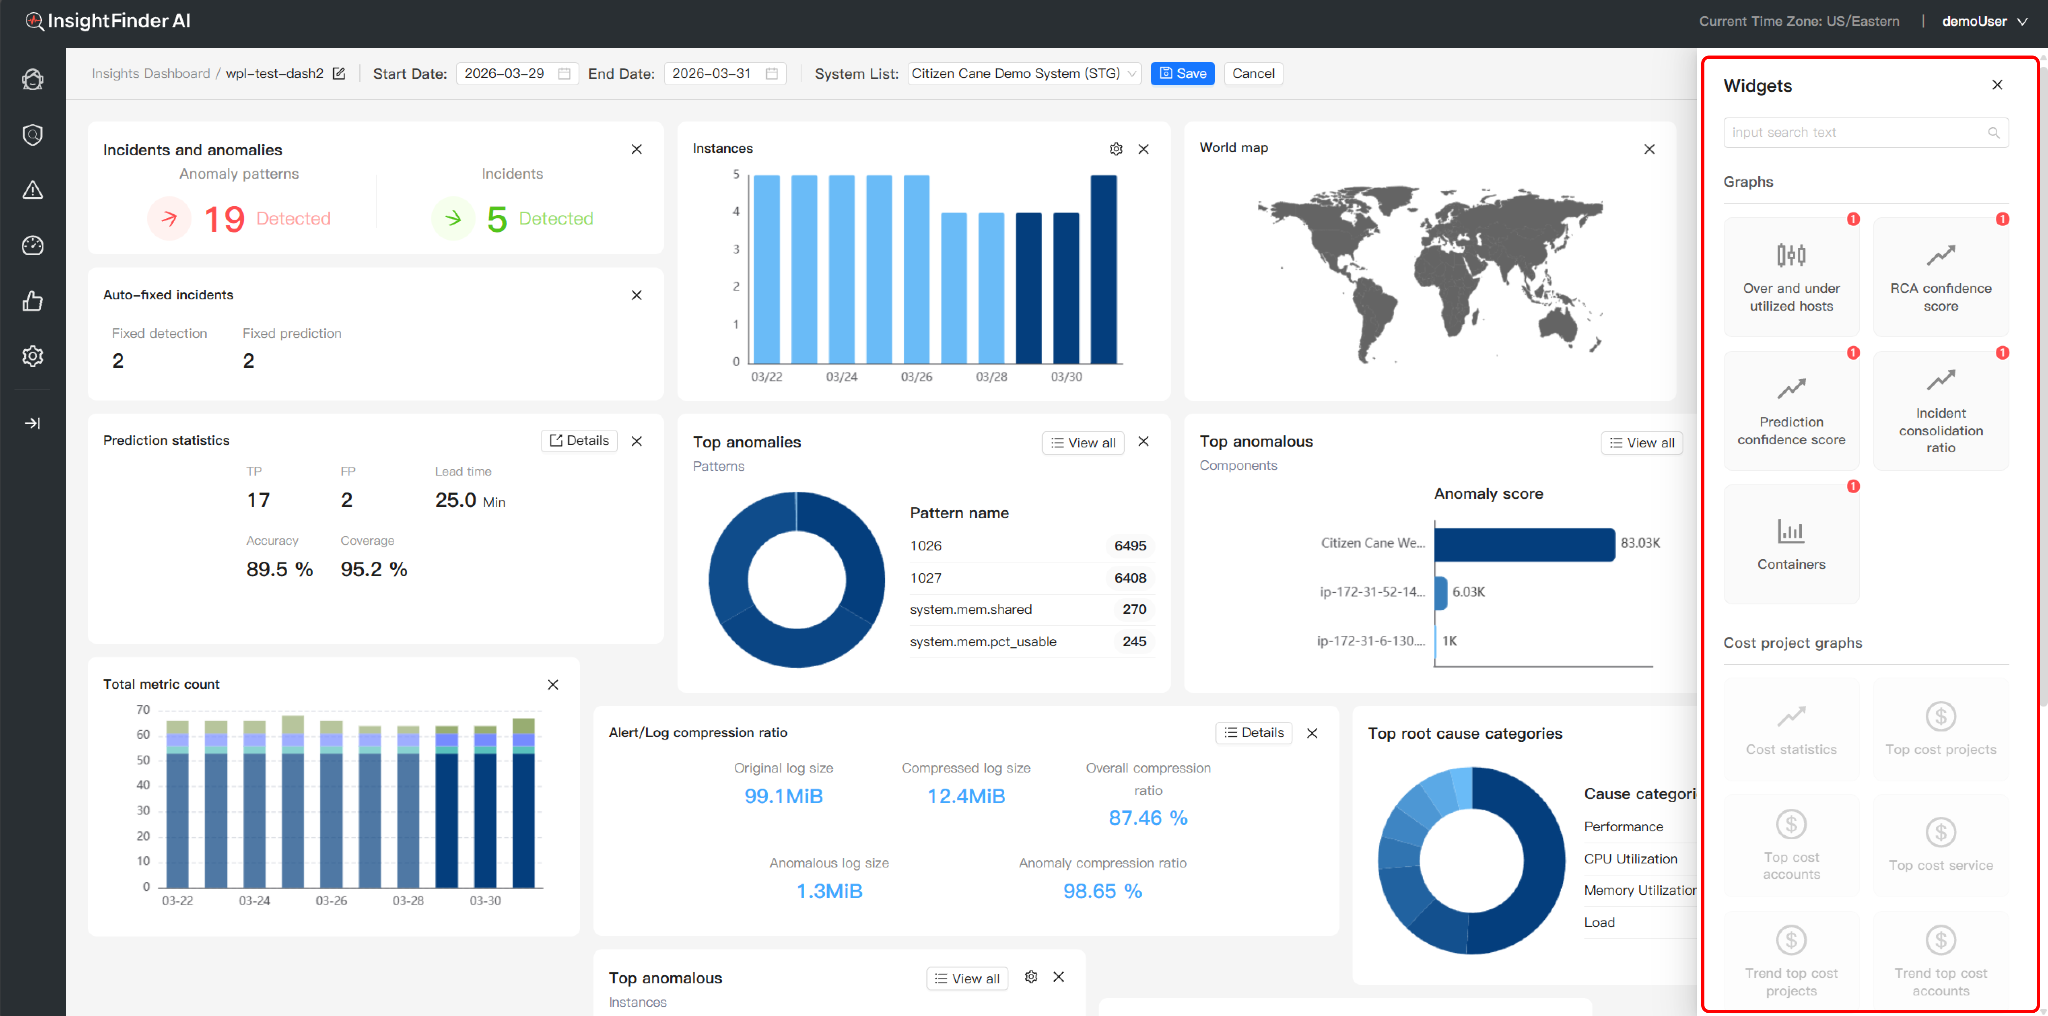
- The Widget Library (Automatic Sidebar):Entering edit mode automatically triggers the right-side management panel. Here, you can directly search for and toggle specific components on or off. This allows you to instantly visualize changes and keep your workspace focused.
- Interactive Controls:Add new insights or close unnecessary tiles in real-time, then click “Save” to lock your personalized configuration
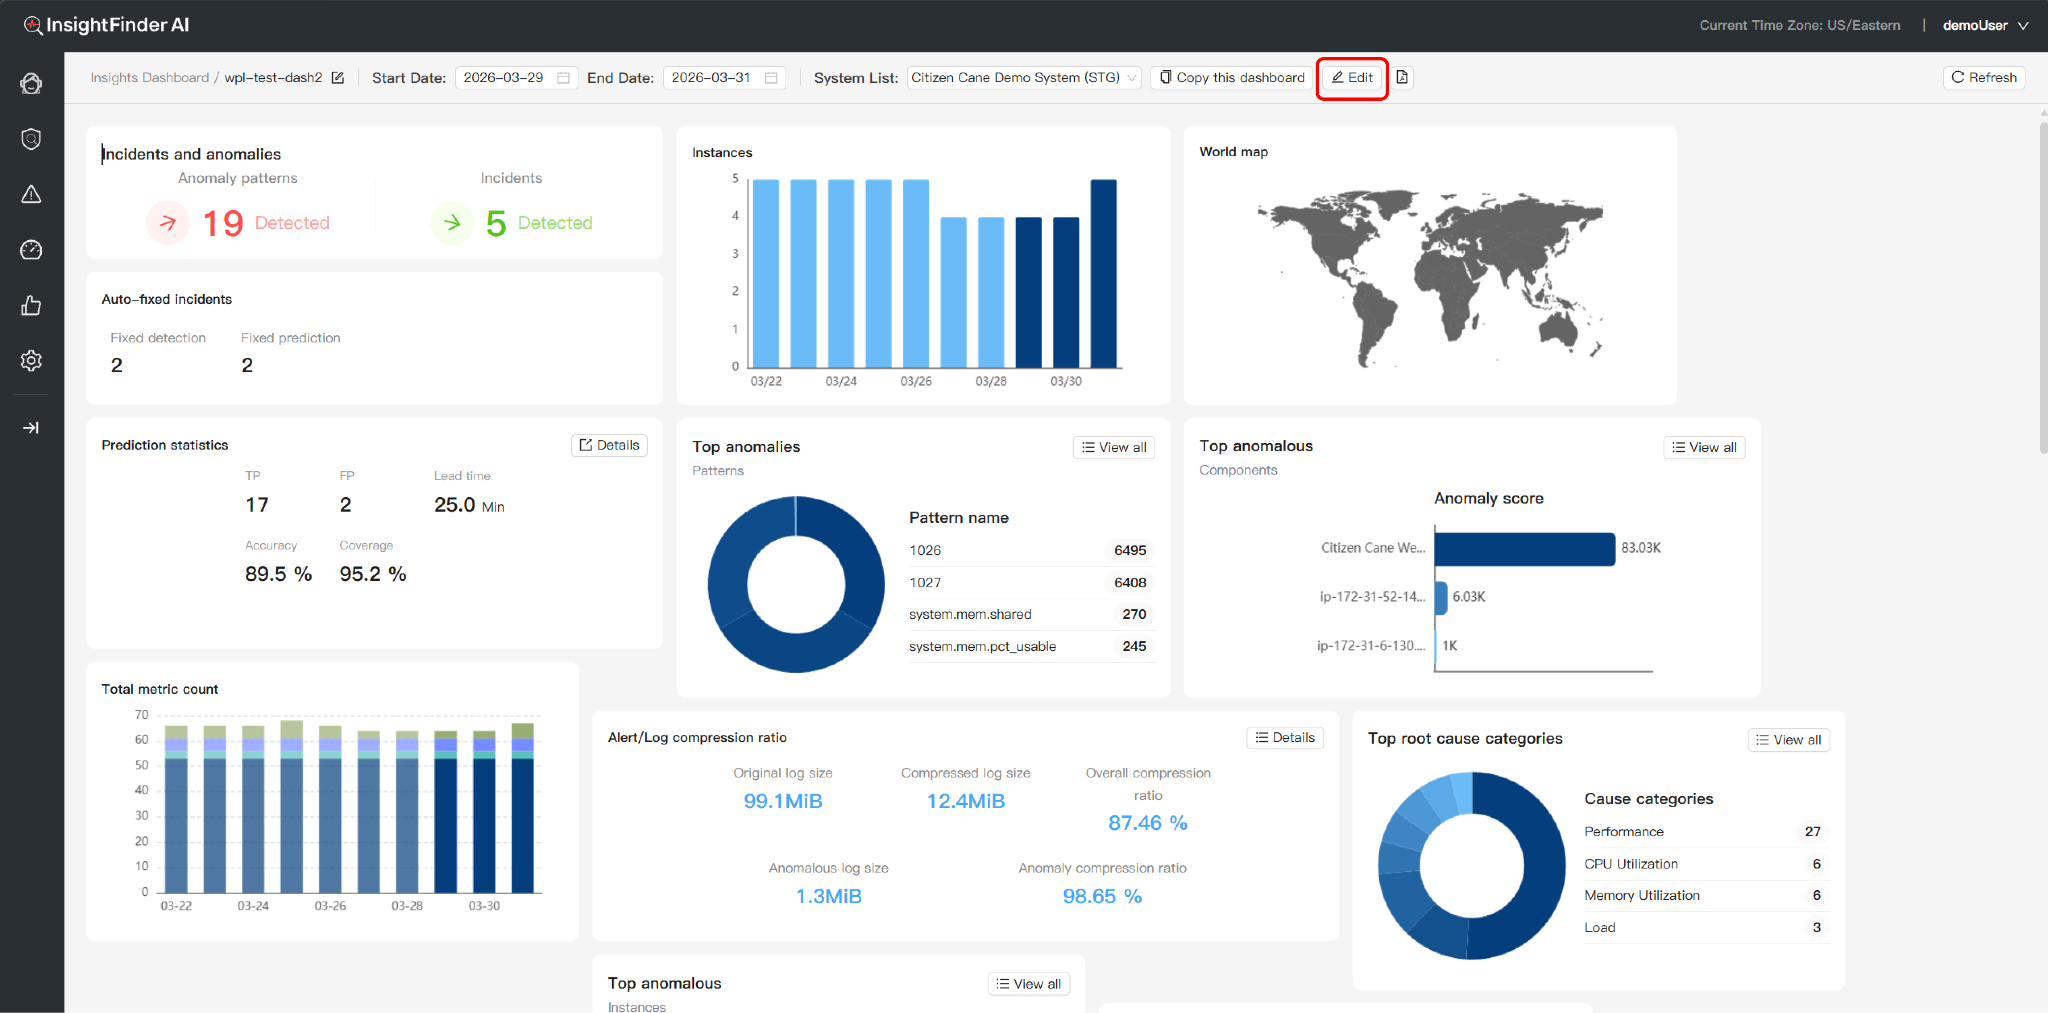
3. Monitoring Categories & Widget Definitions
A. AIOps & Diagnostic Graphs: Operational & AI Diagnostics
This category focuses on System Health Monitoring, Rapid Incident Identification, and AI-driven Root Cause Analysis.
- Incident & Anomaly Identification
- Incident statistics: Visualizes the frequency trend of alerts to identify sudden system spikes.
- Top anomalous (Components/Instances): Pinpoints specific instances with the highest failure rates.
- Top anomalous/incidents (Patterns): Uses AI to cluster recurring issue signatures, helping users extract systemic risks from scattered alerts.
- AI Diagnostic & Analysis Performance
- Top Root Cause Categories: Automatically classifies complex failures (e.g., Network, Resource Exhaustion) to accelerate initial troubleshooting.
- RCA / Prediction confidence score: Indicates the reliability percentage of the AI’s diagnostic and predictive findings, quantifying analytical precision.
- Auto-fixed incidents: Tracks the number of issues resolved via automated remediation scripts, highlighting self-healing efficiency.
- Alert/Log compression ratio (Signal Extraction): Measures how effectively the system extracts valid signals from raw data. A higher ratio reflects superior identification precision.
- Incident consolidation ratio: Measures the system’s ability to merge related failure points into a single logical incident, significantly reducing information overload.
- Volume & Spatial Metrics
- Total metric/log count: Monitors the total data throughput being processed.
- System instance / Instances / Containers: Real-time inventory of active operational assets.
- World map: Spatial visualization of service across global regions.
- Honeycomb map: A high-density heat map to instantly identify “sub-health” nodes in large-scale clusters.
- Prediction statistics: Forecasts future system behavior based on AI algorithms for proactive risk warning.
B. Cost Project Graphs: Financial & Resource Governance
Used for cloud cost auditing and monitoring resource ROI.
- Cost statistics: Time-series trend of total financial expenditure.
- Top cost (Projects/Accounts/Services): Identifies the largest spenders across different organizational dimensions.
- Trend top cost: Monitors the growth slope of spending to detect budget drifts caused by misconfigurations or traffic spikes.
C. Kubernetes: Container Orchestration
Dedicated status and resource monitoring for K8s-native environments.
- Hosts / Pods: Real-time tracking of the deployment and operational status of K8s nodes and individual pods.
From the Blog


See how InsightFinder helps your team deliver reliable services across every layer of the stack
Take InsightFinder AI for a no-obligation test drive. We’ll provide you with a detailed report on your outages to uncover what could have been prevented.
