Welcome to InsightFinder Docs!
Categories
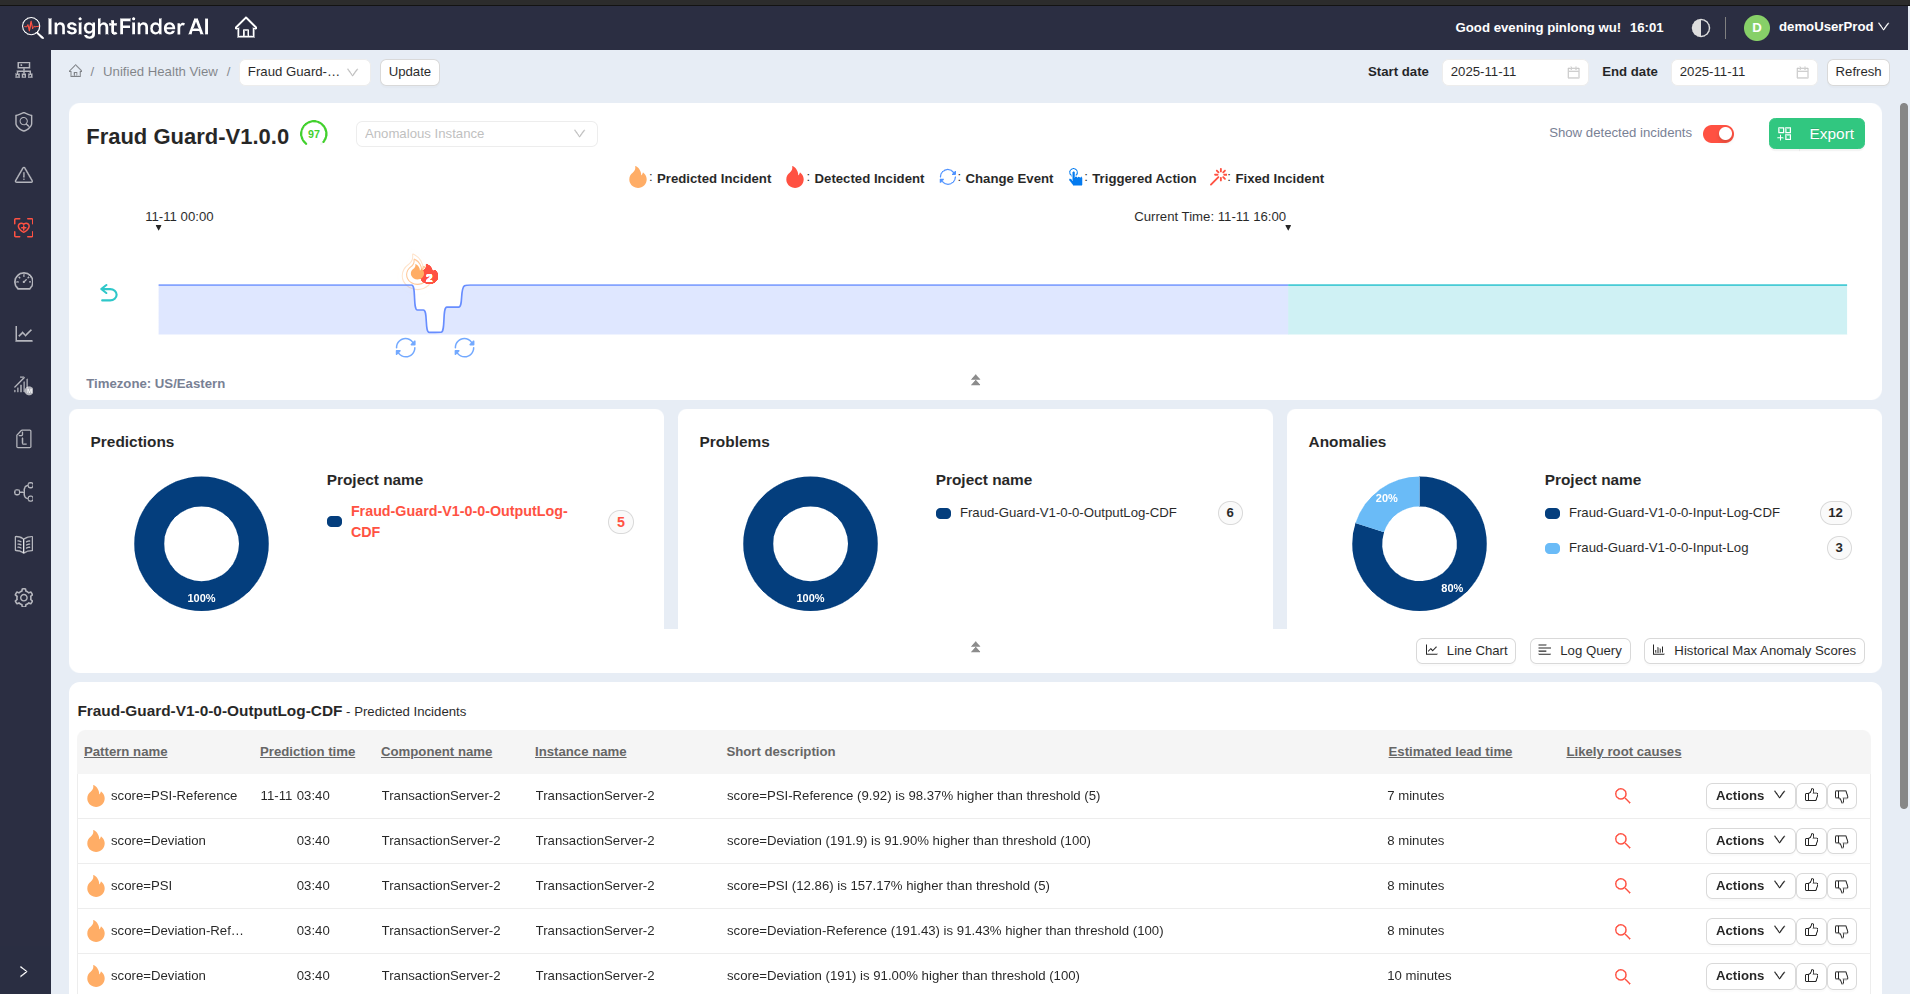
Timeline
The Timeline contents will populate based upon the System Selection and Date & Time Selections. The Timeline graph will adjust based upon the Current Score calculated for the System. The Timeline will also provide visual icon representations of Changes, Incidents (actual and predicted), and Automated Actions. The numbers in the icons will correspond with contents in the Alerts / Changes and Incidents columns directly below the Timeline. Clicking on any of the icons will allow the user to view the Details pane and interact with the item to do tasks such as, mark as important (![]() ), mark as ignored (
), mark as ignored (![]() ), report to another tool (
), report to another tool (![]() ), etc. The Details pane will also show the Prediction or Root cause rank list when available. Clicking the ‘Show Historical Prediction’ checkbox will show what and when Incidents have been predicted.
), etc. The Details pane will also show the Prediction or Root cause rank list when available. Clicking the ‘Show Historical Prediction’ checkbox will show what and when Incidents have been predicted.
From the Blog


See how InsightFinder helps your team deliver reliable services across every layer of the stack
Take InsightFinder AI for a no-obligation test drive. We’ll provide you with a detailed report on your outages to uncover what could have been prevented.
