Welcome to InsightFinder Docs!
Categories
Metric Configuration (Metric)
Metric Settings
The Metric Settings section allows you to configure, tune, and manage how metric data is analyzed, detected, and correlated in InsightFinder UIE.
This includes defining thresholds, setting detection parameters, managing components, and customizing anomaly detection behavior.
Accessing Metric Settings
- Log in to InsightFinder UIE
- Navigate to Settings → System Setting.
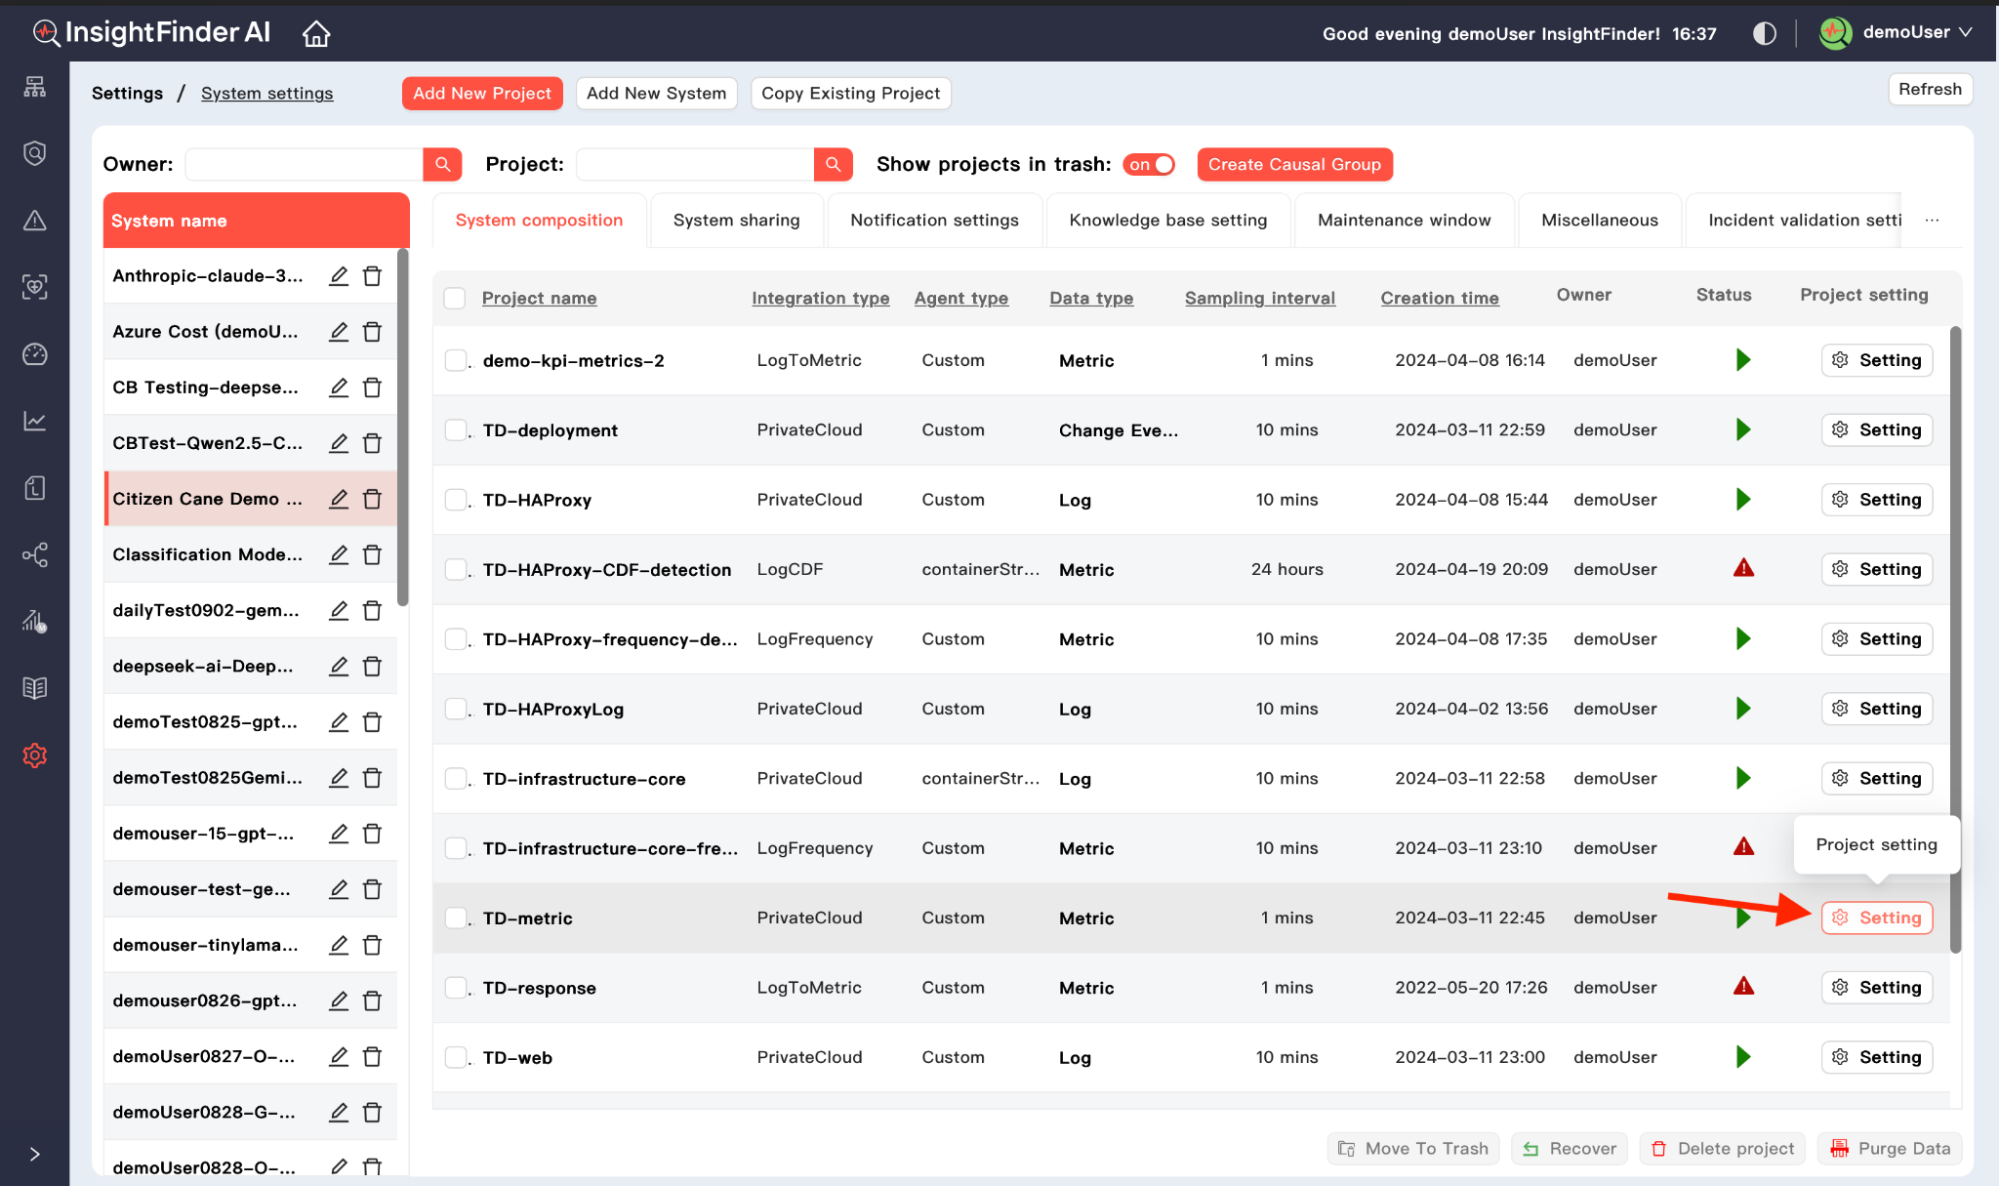
- Select the appropriate System, then click the gear icon settings next to the Metric project you want to configure.
- Click on the Metric Configuration tab to open the Metric configuration page
Pattern Name Generation Rule
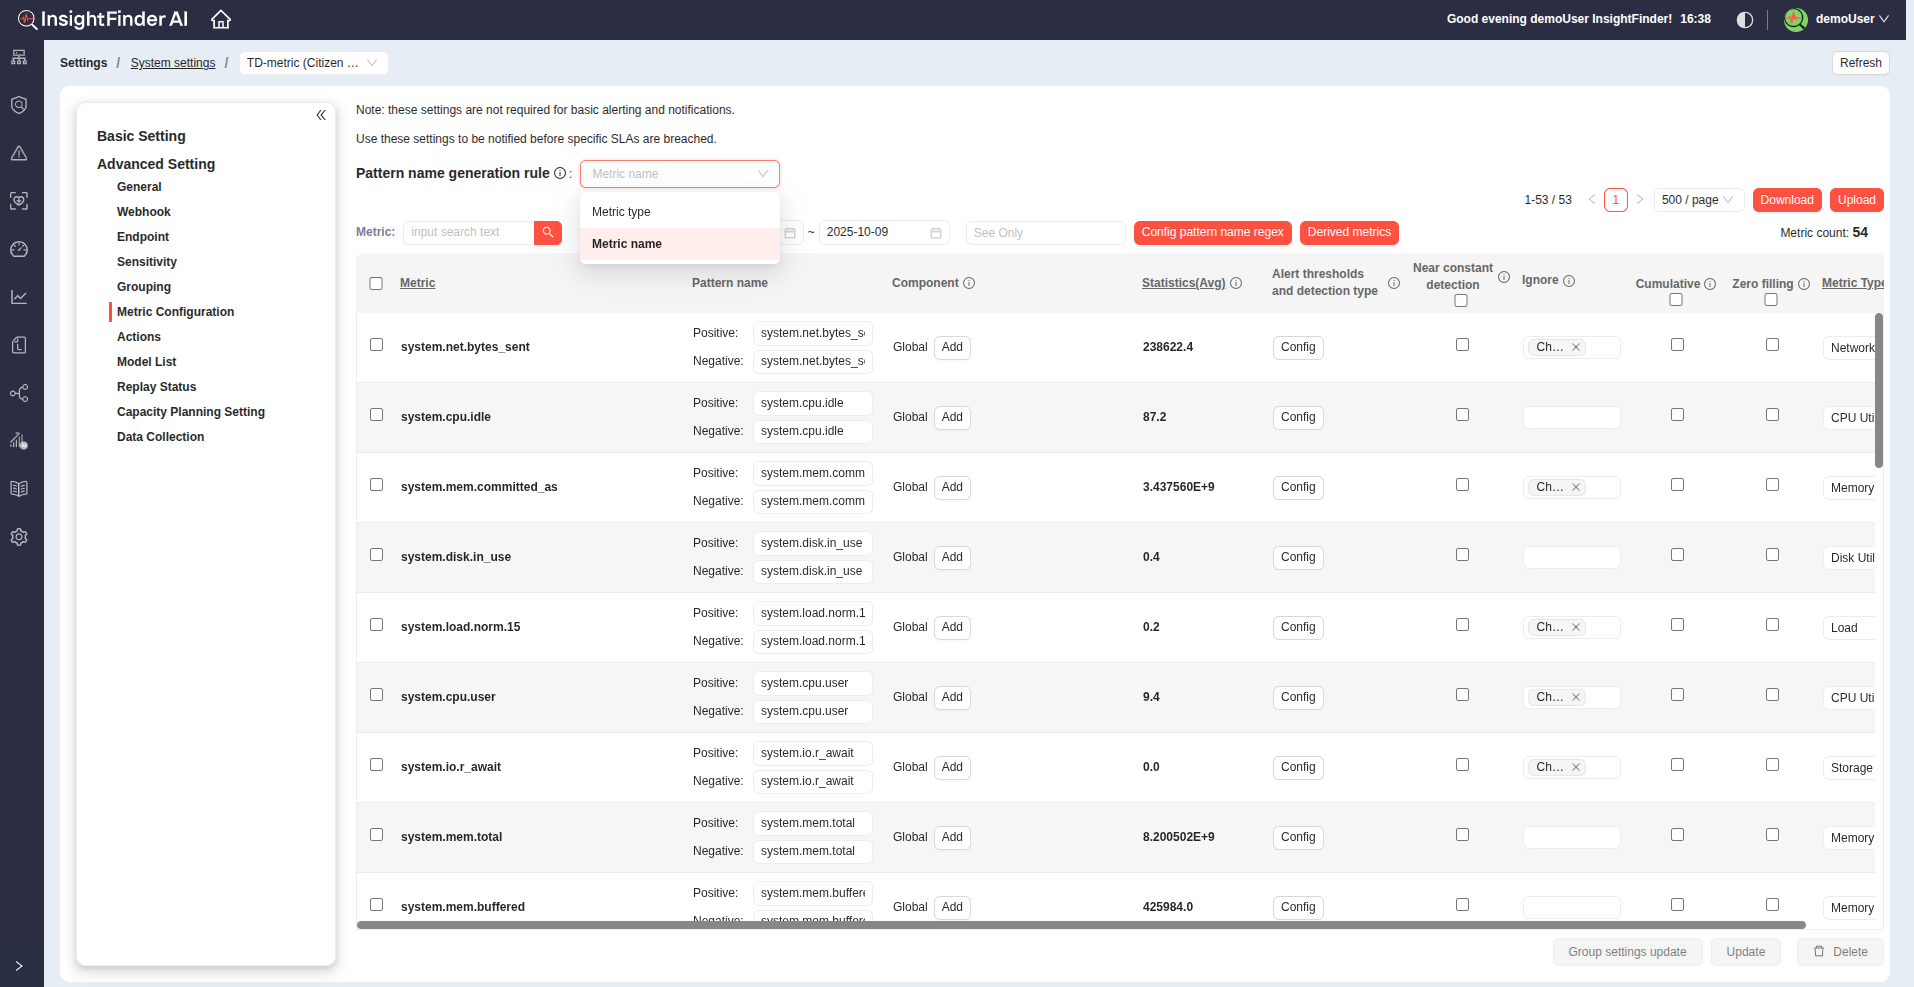
At the top of the Metric Configuration page, you’ll find the Pattern Name Generation Rule, which determines how unique pattern names are generated for metrics.
Options:
- Metric Name: Generates unique pattern names based on the metric name.
- Metric Type: Generates unique pattern names based on the metric type.
Note:
- If you select Metric Type, the Pattern Name column will not be available.
Metric Configuration Columns
| Column | Description |
| Metric | Displays the metric name. |
| Pattern Name | Contains both Positive Pattern Name and Negative Pattern Name for each metric and is configurable. (Only visible if Pattern Name Generation is set to Metric Name.) |
| Component | The component associated with this metric configuration. Default is Global. You can click Add to configure additional components. |
| Statistics (Avg) | Shows the average value of this metric over the selected time period. |
| Near Constant Detection | A checkbox to detect slight deviations in metrics that normally stay constant. |
| Ignore | Allows ignoring anomalies on specific components. Choose from the dropdown list. |
| Cumulative | Checkbox indicating the metric is a counter-type that continuously increases. |
| Zero Filling | Checkbox to fill missing data points with a zero value. |
| Metric Type | The category or group this metric belongs to. You can click Edit Metric Type to add or modify metric types. |
| Alert Thresholds & Detection Type | Opens detailed configuration options for alerting and anomaly generation. Click Config to open a dialog box. |
Alert Thresholds and Detection Type Configuration
Clicking the Config button opens a detailed configuration dialog
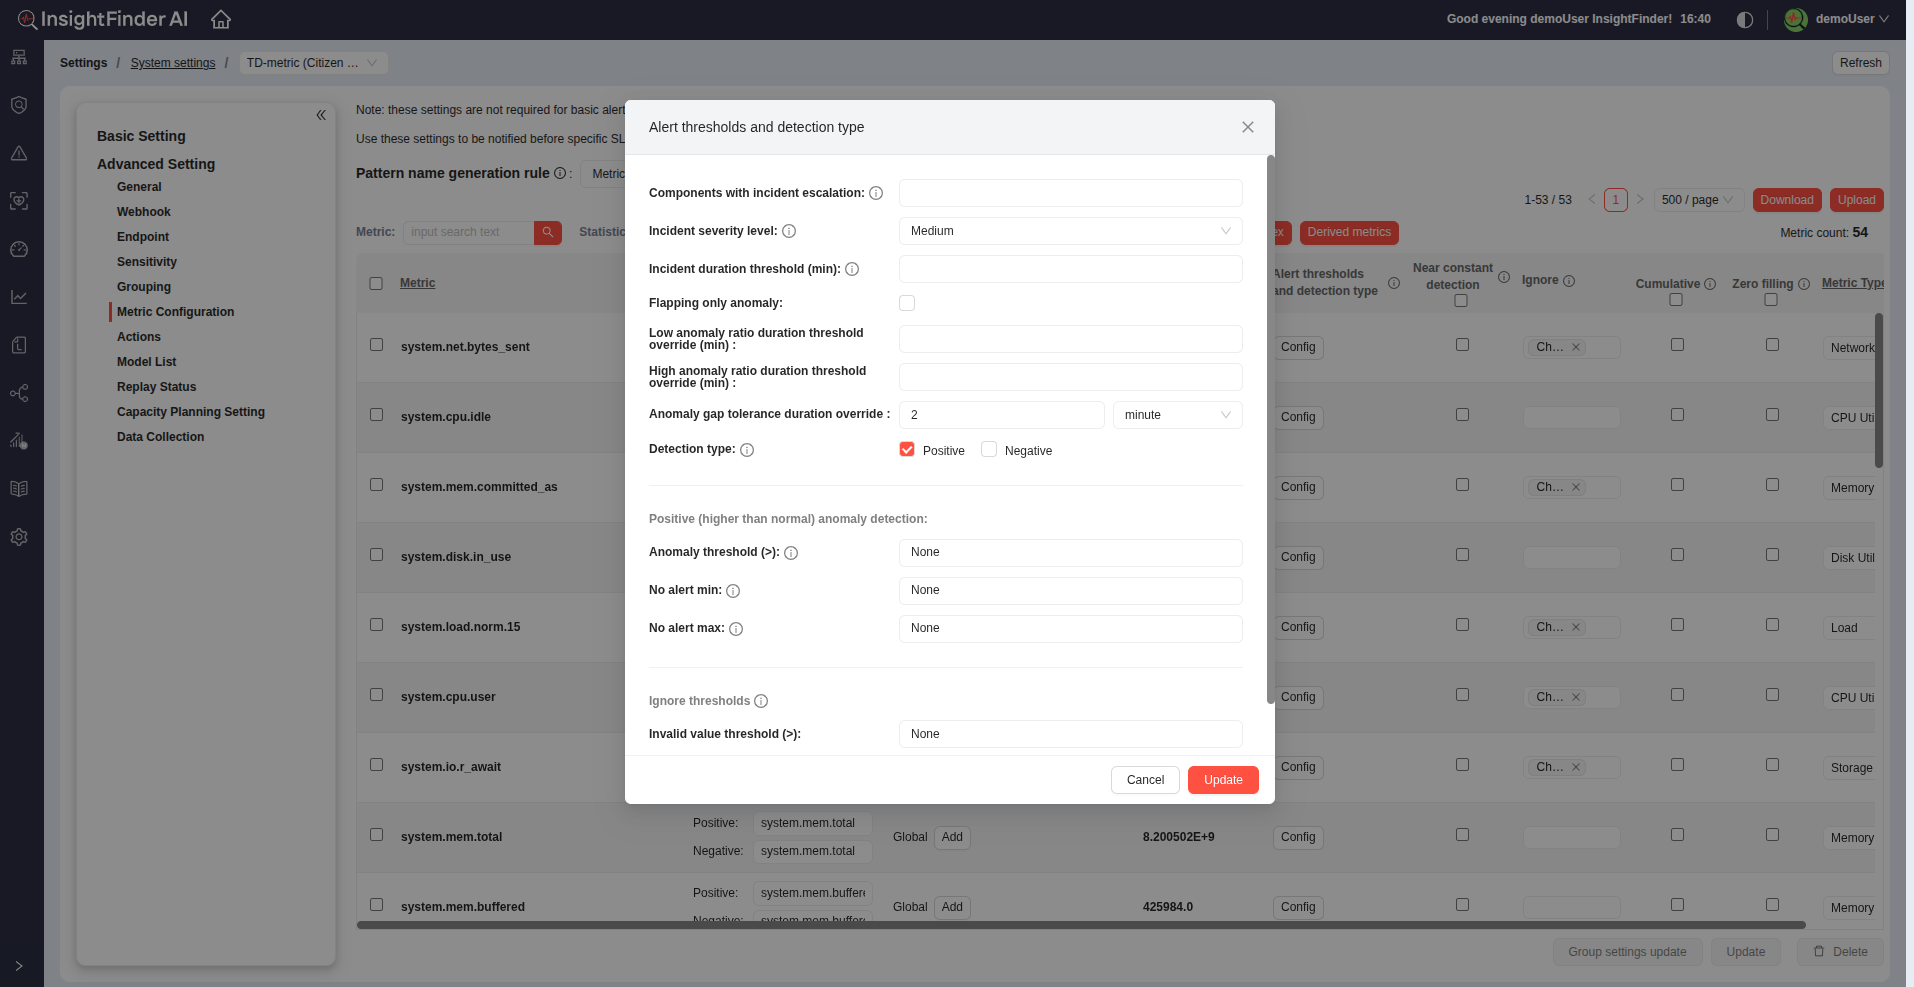
Below are the available options:
Incident Escalation and Severity
- Components with Incident Escalation:
Choose which components should escalate anomalies into incidents (from dropdown). - Incident Severity Level:
Select the severity of generated incidents:- Medium
- Medium High
- High
- Incident Duration Threshold (min):
An anomaly must persist for at least this duration before being escalated to an incident.
Anomaly Behavior
- Flapping Only Anomaly:
Checkbox option to identify rapidly fluctuating anomalies. - Low/High Anomaly Ratio Duration Threshold Override (min):
Optional override durations for anomaly persistence evaluation. - Anomaly Gap Tolerance Duration Override:
Defines the tolerance gap between consecutive anomalies (in minutes, hours, or days).
Detection Type
Select whether to detect Positive, Negative, or Both types of anomalies:
- Positive (Higher than Normal) Detection:
- Anomaly Threshold (>): Generate anomaly when metric value exceeds this threshold.
- No Alert Min: Suppress alerts below this value.
- No Alert Max: Suppress alerts above this value.
- Negative (Lower than Normal) Detection:
- Anomaly Threshold (<): Generate anomaly when metric value falls below this threshold.
- No Alert Min: Suppress alerts above this value.
- No Alert Max: Suppress alerts below this value.
Ignore Thresholds
Used for filtering out invalid or out-of-bound metric values.
For example, in disk usage metrics (percentage-based), any value below 0 or above 100 can be ignored.
- Invalid Value Threshold (>): Ignore values greater than this.
- Invalid Value Threshold (<): Ignore values less than this.
After configuring all parameters, click the Update button to save your changes.
Additional Metric Filtering
Below the main configuration, you can apply filtering and viewing options for metric management:
- Statistics Time:
Select a time window using Start Date and End Date to review metrics historically. - Filter Options:
Filter metrics by category:- KPI Metrics
- Non-KPI Metrics
- Cumulative Metrics
- Threshold Alerting Metrics
- Pattern Name Regex:

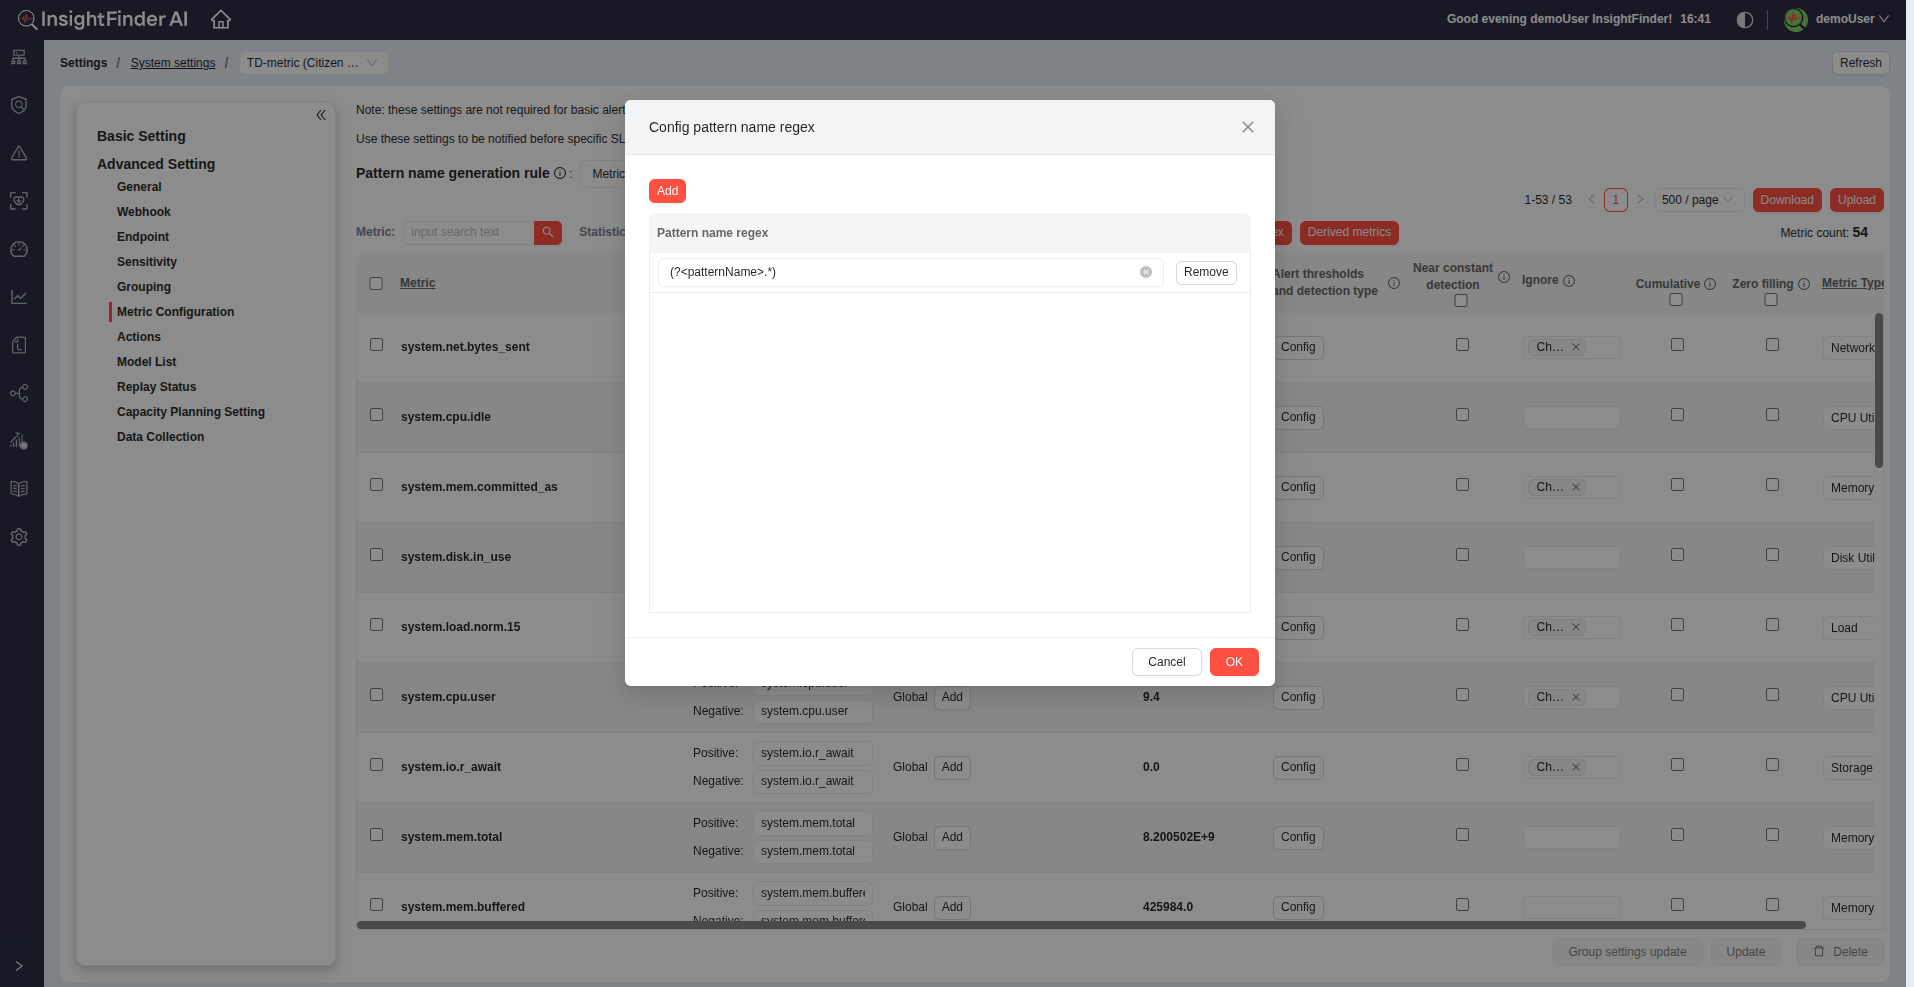
Configure regex-based pattern names for grouping or identifying related metrics. Click Config Pattern Name Regex to add or modify patterns.
Derived Metrics Configuration
Click the Derived Metrics button to define new metrics derived from existing ones.
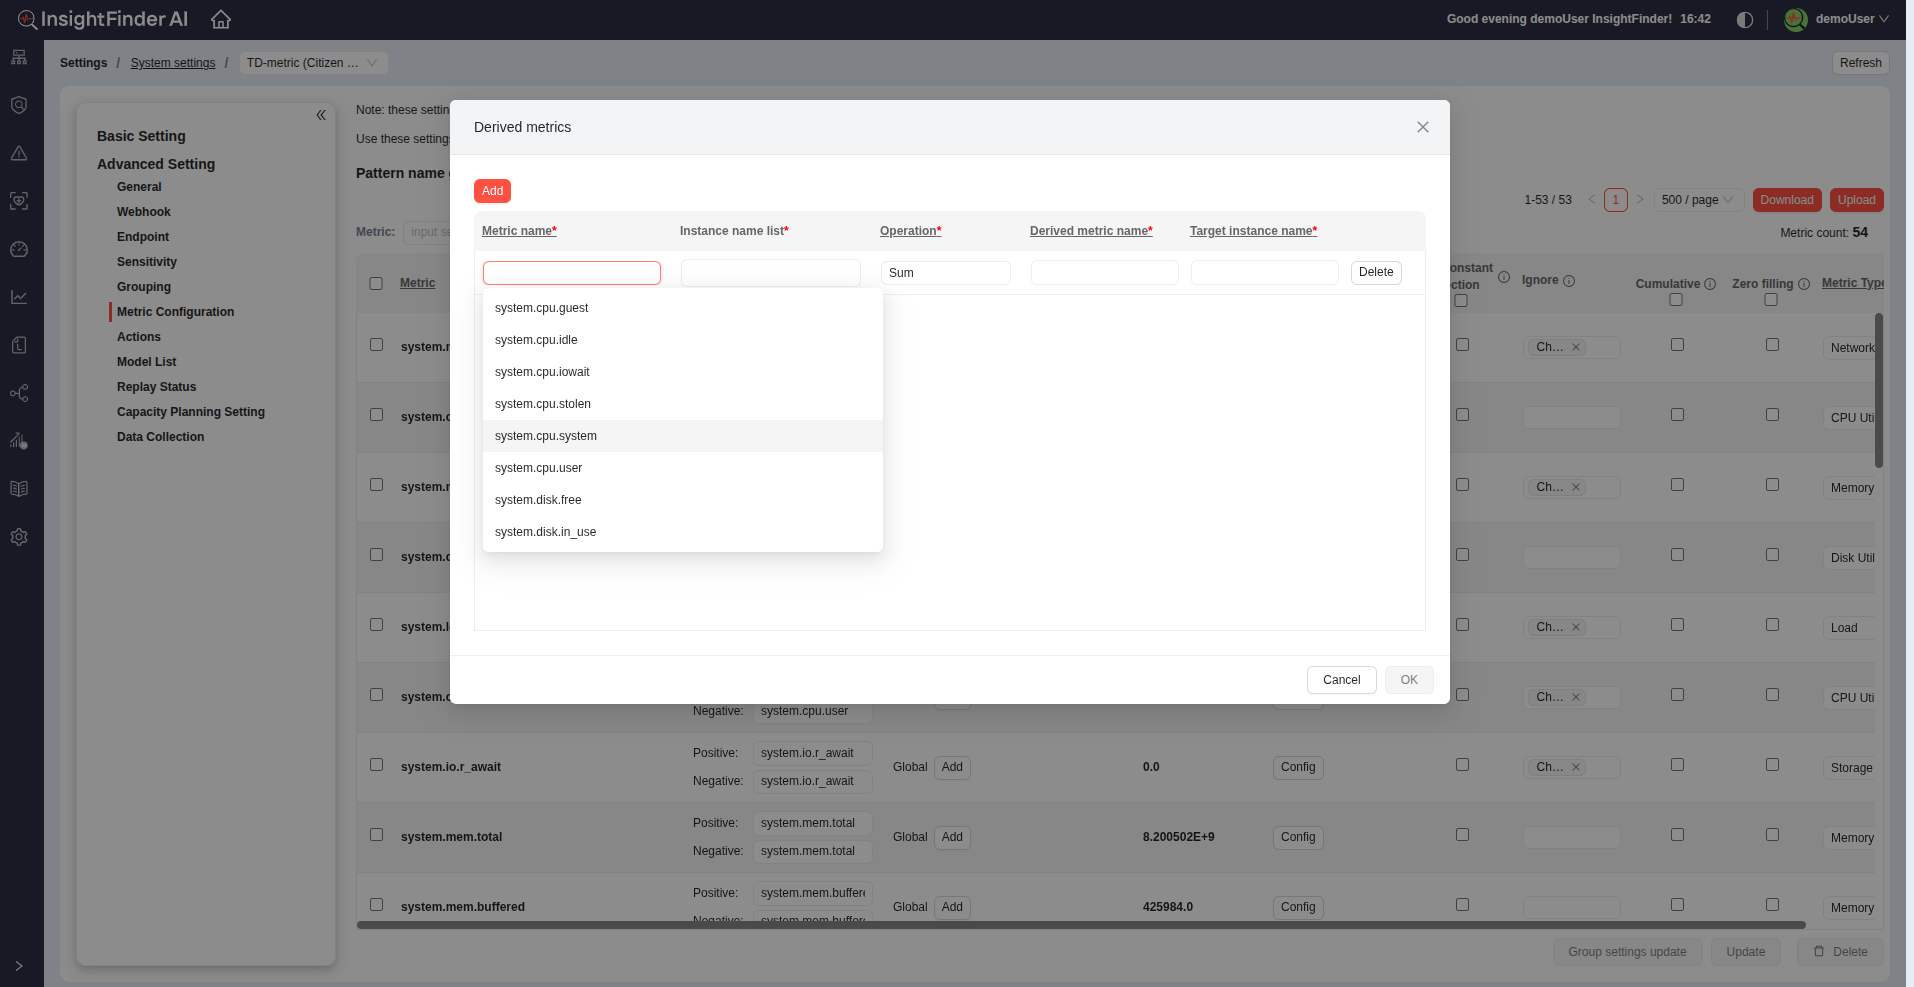
Each derived metric supports the following parameters:
| Field | Description |
| Metric Name* | Base metric name used for derivation. |
| Instance Name List* | List of instances to be included in the derivation. |
| Operation* | Operation used for calculation (SUM, AVERAGE, etc.). |
| Derived Metric Name* | Name for the new derived metric. |
| Target Instance Name* | The instance to associate the derived metric with. |
All fields marked with an asterisk (*) are required.
Download and Upload Metric Configuration
You can easily export or import metric configurations using the Download and Upload buttons.
- Download: Exports the current metric configuration to a .csv file.
- Upload: Imports metric configurations from a .csv file for batch setup or migration.
Note:
Don’t forget to click the Update button at the bottom of the page to save all your changes.
From the Blog
See how InsightFinder helps your team deliver reliable services across every layer of the stack
Take InsightFinder AI for a no-obligation test drive. We’ll provide you with a detailed report on your outages to uncover what could have been prevented.
