Mutli-agent workflows are skyrocketing in popularity. But when they fail, that’s when the real drudge work begins.
A single user request can branch into planning, retrieval, tool calls, sub-agent handoffs, human review, and other steps. Even with check and balances built-in, you can still get back answers that look incredibly confident but are entirely wrong. When that happens, most teams do what they’ve always done: stitch together logs, correlate timestamps, and guess which step went sideways.
But with agentic workflows, failures rarely live in one place and the evidence rarely lives in one file. Multi-agent tracing makes the full execution path visible, searchable, and debuggable. In this post, you’ll learn how to use InsightFinder to understand every step your agents take.
Why multi-agent debugging breaks traditional observability
Traditional applications have a relatively stable call graph. Agents break that assumption because the “application” is a decision process, not a fixed route. In the same workflow, one request might use retrieval, another might skip it, and a third might loop through tool calls until a constraint is met. Even when the system technically succeeds, it can still waste tokens, inflate latency, or quietly degrade output quality.
That mismatch shows up during incidents in a familiar pattern. With traditional observability, teams see a user complaint or a cost spike, metrics look normal, and the on-call engineer starts digging. Perhaps they find scattered artifacts: an LLM response that seems fine, a tool invocation that returned partial data, a retriever that pulled the wrong document, and a planner that routed to a fallback sub-agent. None of those pieces alone explains the failure, but together they do.
Observability for AI agents is achieved by capturing a full execution flow: branching decisions, tool calls, memory reads, and sub-agent handoffs. Without a cohesive end-to-end record, debugging becomes a reconstruction exercise: it wastes time and it doesn’t scale.
What InsightFinder’s multi-agent tracing captures
InsightFinder’s Multi-Agent Trace and Observability provides end-to-end visibility into agentic workflows that automatically captures interactions across coordinators, sub-agents, LLM calls, tool invocations, and human review steps, then presents them as one structured distributed trace.
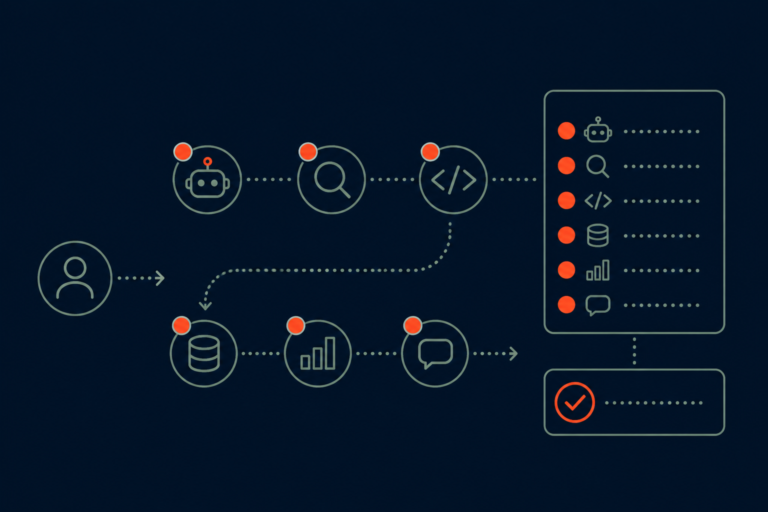
For example, let’s say a user asks something like “send a project status email.” An agentic workflow might move through a coordinator agent, an analyzer, a drafter, an executor, and one or more human approval checkpoints. Traditional observability stores each step as a pile of disconnected events. Multi-agent tracing keeps those steps linked under a single trace so responders can see the complete story.
Distributed tracing gained traction for its efficacy in debugging large-scale distributed cloud systems. But AI agent tracing isn’t just about latency and errors. It also supports monitoring token usage and estimated cost at the trace, session, and workflow levels. It supports automated evaluations for quality and safety issues such as hallucinations, bias, and toxicity across LLM interactions. And it helps you see every aspect of performance when long, complex, multivariate execution paths are taken during any given transaction.
In other words, it’s perfect for understanding multi-agent workflows.
Why this matters to technical leaders
For technical leaders, multi-agent tracing changes AI reliability conversation from “AI is unpredictable” to “we can explain what our AI is doing.” The biggest operational risk in agent systems isn’t that they sometimes fail (everything fails). The big risks are when teams can’t explain why, reproduce the path, or prove that a fix actually addressed the cause.
For reliability teams (e.g. SREs or Platform), the value shows up during triage. If a trace clearly shows that the executor’s tool call timed out, that narrows the fix to a deterministic dependency. If the trace shows the analyzer agent produced a factual inaccuracy, that points toward retrieval quality, prompt design, or model routing rather than infrastructure. The trace becomes the shared artifact that lets AI engineers and reliability teams work from the same evidence instead of debating interpretations.
For AI and ML engineers, the value often shows up as cost and performance clarity. Token spikes stop being mysterious because traces expose where the system looped, where prompts grew due to tool payloads, or where the workflow repeatedly revisited the same context. Our multi-agent tracing explicitly supports filtering by total tokens and duration so engineers can isolate the expensive or slow executions and then inspect the exact steps that created unexpected overhead.
How to use multi-agent tracing without getting lost in instrumentation
If you’re accustomed to working with distributed tracing, implementation for multi-agent workflows might sound like a heavy lift (this is why most teams don’t get here). Rather than treating this like a logging project, we believe the key is treating this as a workflow design and data association problem.
With our multi-agent tracing, you follow a distinct three-part path: define the intended workflow, connect traces using OpenTelemetry-compatible instrumentation, then monitor and debug through trace and session views.
The first step is about clarity. Our Workflow Canvas gives you a visual interface to define agents, tools, deterministic functions, database steps, and human-in-the-loop checkpoints. That context matters because it aligns what the system is supposed to do with what it actually did during an execution.
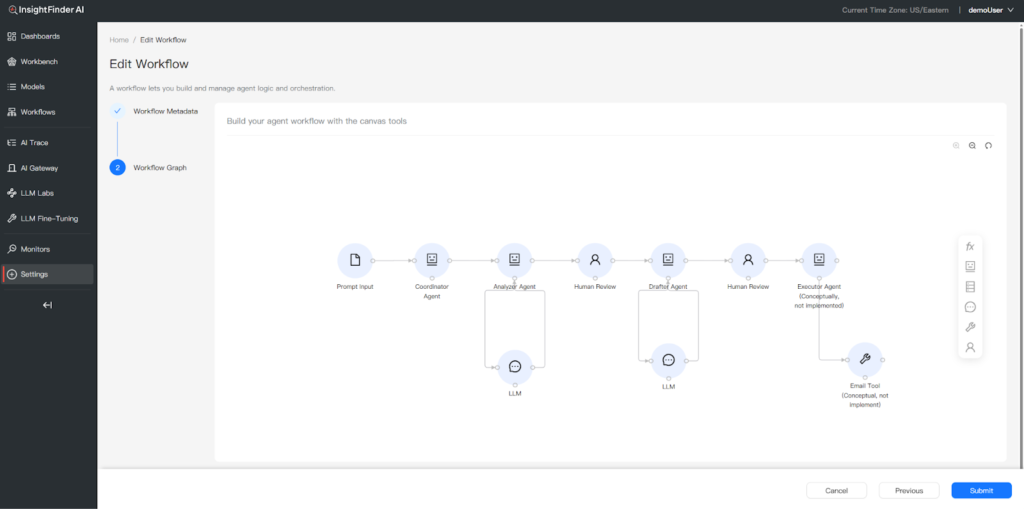
The Workflow Canvas feature lets you define agents, tools, functions, and human-in-the-loop checkpoints that serve as a baseline for understanding what your agents are supposed to do.
The second step is about interoperability. InsightFinder supports OpenTelemetry-compatible traces streamed via OTLP, and you have a variety of ways to integrate that into your applications including OpenInference-based instrumentation, Temporal SDK tracing, Datadog’s ddtrace, pure OpenTelemetry, and InsightFinder’s own iftracer-sdk.
The third step is where understanding happens. InsightFinder’s Trace View provides an end-to-end diagnostic surface with a workflow graph visualization, highlighted problematic nodes, and granular filtering across thousands of requests. Filters include time range, anomaly score, duration, and total tokens. This is how teams quickly go from “we saw a cost spike” to “these are the transactions that explain it.” No manual hunting and stitching required.
Analyzing sessions is the other half of achieving clarity, understanding, and reliability. With agents, many real failures aren’t single turns. Instead, they’re multi-turn interactions where the agent drifts, repeats work, or accumulates incorrect context. By grouping related traces into sessions, you can quickly understand multi-turn conversations and the end-to-end user experience behind agentic interactions. This is what leadership actually cares about when customer trust is on the line.
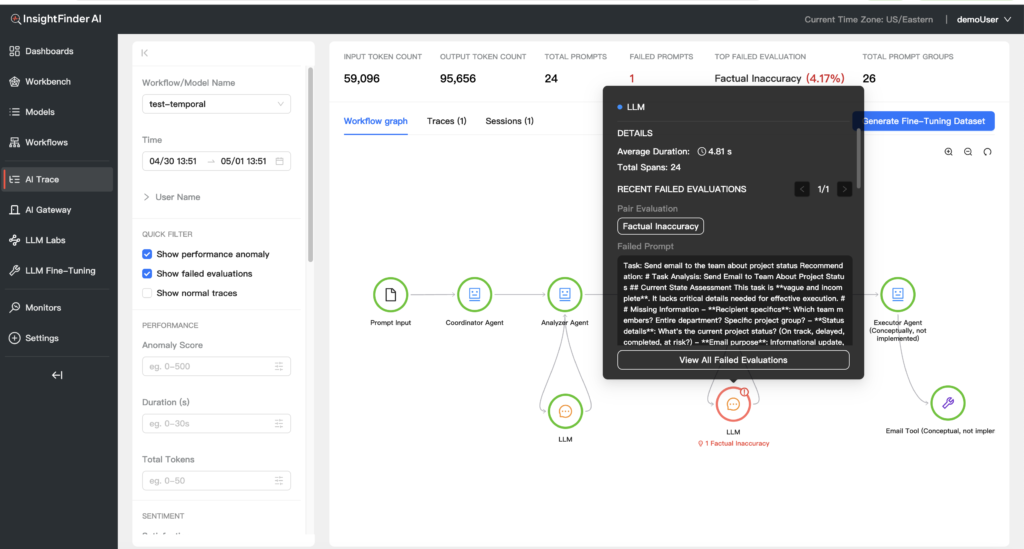
The Multi-Agent Tracing feature shows you where in your workflows anomalies or failures are detected. In this example, a sub-agent is given ambiguous details for determining email recipients. That gets flagged as a failed evaluation in the multi-agent workflow with the correct source identified.
When your team is ready for multi-agent tracing
There’s a specific kind of incident that makes multi-agent tracing feel non-negotiable. Let’s say a customer reports that an agent “made something up,” but only once. The system didn’t error. Latency didn’t spike. The output looked… plausible enough. Without multi-agent tracing, the team can’t isolate the exact run. But let’s also say that somehow, they dig around and hunt long enough to actually find it. They still can’t see which step introduced the bad premise.
With multi-agent tracing, the investigation becomes more like standard root cause analysis. The team identifies the trace, sees the retrieval step returned irrelevant context, observes the analyzer agent accepted it, and then confirms the drafter agent amplified it into a confident response. That chain isn’t just useful for fixing the prompt or retriever. It’s what lets teams explain the incident internally, document corrective actions, and validate that the same pattern no longer appears in future traces.
Agentic systems aren’t going back to single-prompt simplicity. The teams that operate agentic workflows reliably are those that treat end-to-end observability as a first-class capability. Multi-agent tracing gives engineers a durable way to answer the questions that actually matter in production: what happened, where it happened, what it cost, and why it produced this outcome.
Try multi-agent tracing on your own agent workflows
If your team is running agents in production, the fastest way to see the value is to try this for yourself. Find out what’s going on with that handful of “weird” runs that you can’t currently explain. That’s when teams stop debating guesswork and start debugging with evidence.
To explore multi-agent tracing in your environment, request an InsightFinder demo and ask specifically about Multi-Agent Tracing and AI Observability. Or Sign Up for Free and try it yourself.
