Welcome to InsightFinder AI Observability Docs!
Categories
Multi-Agent Trace & Observability
1. Overview
1.1 The Challenge: Debugging Multi-Agent AI Systems
Modern AI applications are moving beyond simple, single-prompt interactions. Instead of one model answering one question, today’s systems often involve multiple AI agents working together—each with a specialized role—to complete complex tasks. For example, when a user asks an AI system to “send a project status email to the team,” the request might flow through a Coordinator Agent (which decides what to do), an Analyzer Agent (which evaluates the task), a Drafter Agent (which writes the email), and finally an Executor Agent (which sends it). Human reviewers may approve outputs at key checkpoints along the way.
These multi-agent workflows are powerful, but they introduce a significant challenge: when something goes wrong—a slow response, a factual error, an unexpected output—it can be extremely difficult to figure out where the problem occurred. A single user request may trigger dozens of intermediate steps across multiple agents and LLM calls, making manual debugging impractical.
1.2 The Solution: Multi-Agent Trace & Observability
Multi-Agent Trace is InsightFinder’s purpose-built observability feature that provides end-to-end visibility into these agentic AI workflows. It automatically captures every interaction—between coordinators, sub-agents, LLM calls, tool invocations, and human review steps—and presents them as a structured, searchable trace. This enables teams to:
- Pinpoint failures: See exactly which agent or step in the workflow caused an error, timeout, or unexpected output.
- Detect anomalies automatically: InsightFinder’s AI Reliability, powered by patented unsupervised machine learning algorithms, identifies performance issues, factual inaccuracies, and safety violations—without requiring manual threshold configuration.
- Monitor costs and efficiency: Track input/output token counts, estimated costs, and resource consumption at the trace, session, and workflow level.
- Evaluate quality: Automated evaluations check for hallucinations, bias, toxicity, and other quality issues across every LLM interaction.
- Analyze user sessions: Group related traces into sessions to understand multi-turn conversations and the complete end-to-end user experience.
1.3 How It Works
Getting started with Multi-Agent Trace involves three steps, each covered in detail in this document:
| Step | What You Do | What Happens |
| 1 | Design Your Workflow | Use InsightFinder’s visual Workflow Canvas to define your agents, their roles, tools, and human review checkpoints. This gives InsightFinder context about your system’s intended architecture. |
| 2 | Connect Your Traces | Instrument your agent code with any OpenTelemetry-compatible SDK to stream trace data into InsightFinder. A few lines of configuration are all that’s needed—InsightFinder supports Arize, Temporal, Datadog, pure OpenTelemetry, iftracer-sdk, and more. |
| 3 | Monitor & Debug | Use InsightFinder’s Trace View, Trace Records, and Session Logs to monitor workflow health, investigate anomalies, inspect individual LLM interactions, and analyze user sessions—all from a single dashboard. |
1.4 Who Is This For?
Multi-Agent Trace is designed for:
- ML Engineers debugging agentic pipelines and optimizing model performance.
- Platform Teams building and maintaining reliable AI infrastructure.
- DevOps / SRE Engineers monitoring production LLM systems and preventing incidents.
- Team Leads & Product Managers ensuring consistent AI service quality and managing costs.
1.5 What This Document Covers
The rest of this document walks through each step in detail:
- Section 2 — Workflow Integration: How to design your agent workflow in the Workflow Canvas and connect your trace data using supported SDKs.
- Section 3 — Monitoring, Session Insights & Root Cause Analysis: How to use the Trace View, Trace Records, and Session Logs to monitor, debug, and optimize your multi-agent system.
- Section 4 — Sensitive Data Filtering: How InsightFinder protects PII and sensitive information in trace data.
- Section 5 — Additional Resources: Links to detailed SDK integration guides, model creation documentation, and LLM Labs.
2. Workflow Integration
2.1 Configure the Agent Workflow
Before tracing can begin, users define the logic and orchestration of their agents using the Workflow Canvas—a visual editor for building multi-agent systems.
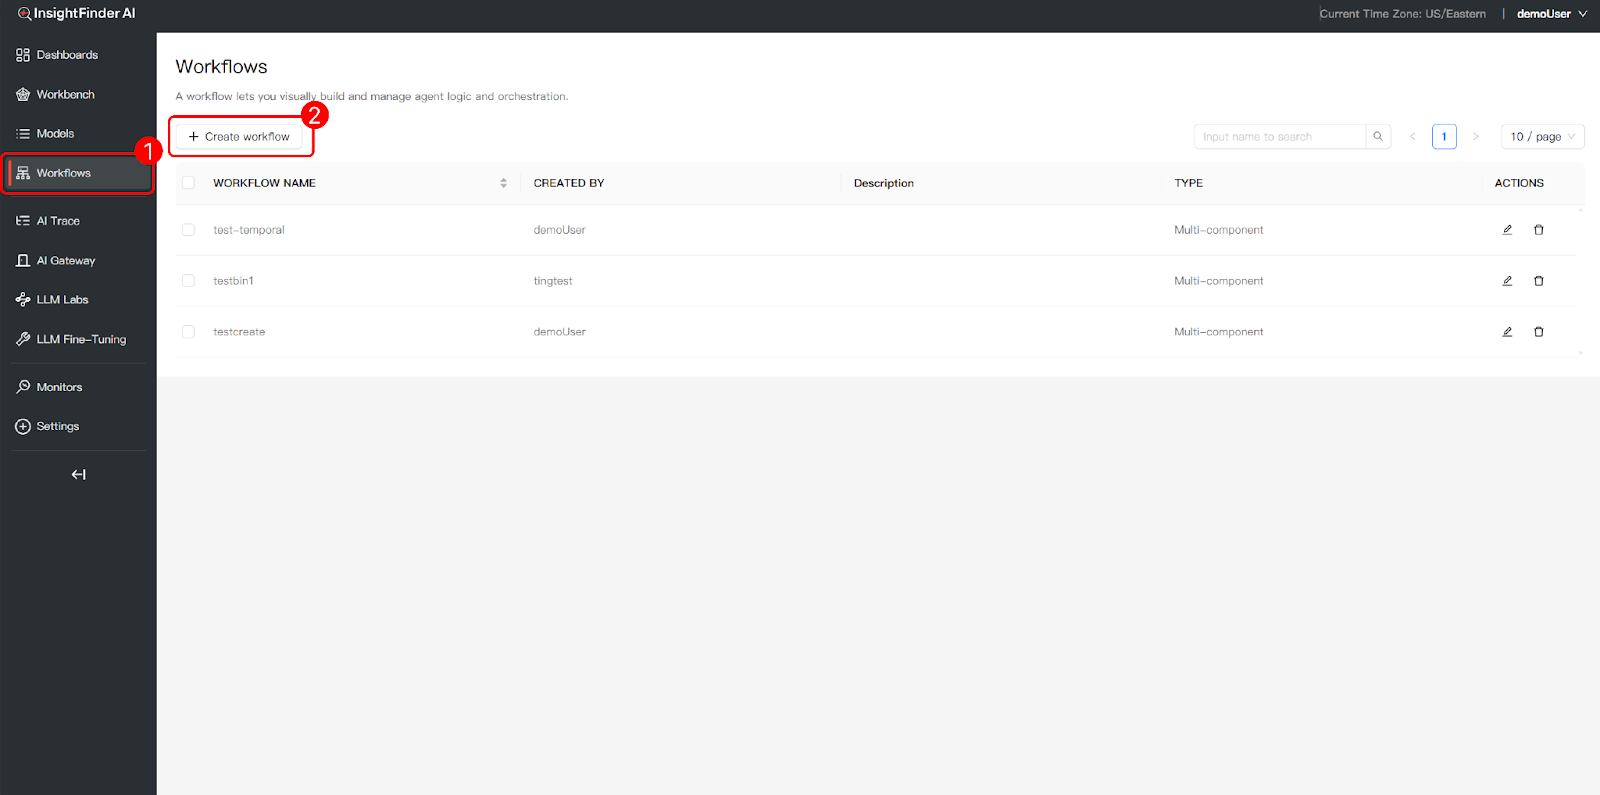
Accessing the Workflow Canvas:
- Navigate to Workflows: Click “Workflows” in the left navigation bar to access the main interface for visual agent logic and orchestration.
- Create a New Workflow: Click the “+ Create workflow” button to start building a new agent workflow from scratch.

Available Node Types
The Workflow Canvas supports the following node types, which can be connected to define the execution flow of your multi-agent system:
| Node Type | Description |
| Agent | Represents an autonomous agent that can make LLM calls, reason, and produce outputs. Examples: Coordinator Agent, Analyzer Agent, Drafter Agent. |
| Function | A deterministic code execution node for data transformations, validations, or business logic that does not require LLM inference. |
| LLM | A direct LLM call node. Use when you need a standalone model invocation without the full agent abstraction. |
| Tool | Connects to external tools and services (e.g., Email Tool, API endpoints, search services) that agents can invoke during execution. |
| Human | Inserts a human-in-the-loop review step, pausing workflow execution until a human reviewer approves, rejects, or modifies the output. |
| DB | A database interaction node for querying or writing to data stores as part of the agent workflow. |
Example: Multi-Agent Email Drafting Workflow
The following example illustrates a typical multi-agent workflow where a user requests the system to “Send email to the team about project status.” The workflow orchestrates multiple agents and human review checkpoints:
- Prompt Input: The user’s request enters the workflow.
- Coordinator Agent: Receives the task and orchestrates the downstream agents. It determines the execution sequence and delegates work to specialized sub-agents.
- Analyzer Agent (LLM call): Analyzes the task, identifies information gaps, and produces a structured recommendation—including clarity assessment, missing context, and suggested actions.
- Human Review: A human reviewer evaluates the Analyzer’s recommendation and approves it before proceeding.
- Drafter Agent (LLM call): Takes the approved recommendation and drafts the complete email content, following the recommended structure.
- Human Review: A second human review checkpoint validates the drafted email before execution.
- Executor Agent (Tool call): Executes the final action—sending the approved email via the connected Email Tool.
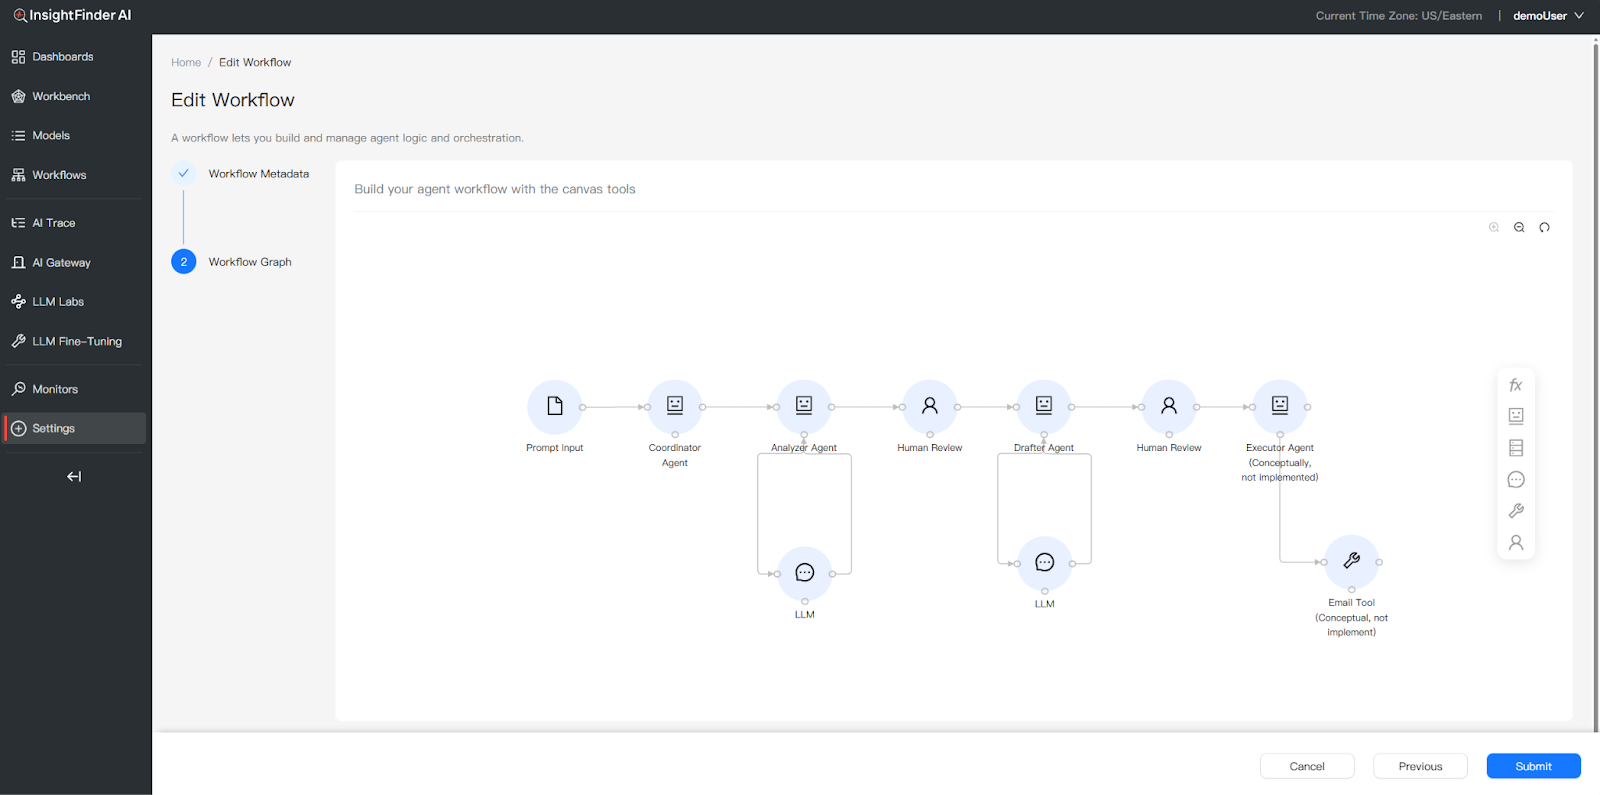
This workflow pattern demonstrates how InsightFinder traces capture every step: each agent’s LLM calls (with prompts, responses, and token counts), human approval signals, and tool execution—all linked under a single Trace ID for end-to-end observability.
2.2 Data Association & Execution
InsightFinder supports agent monitoring via any SDK or framework that emits OpenTelemetry-compatible traces. By leveraging the OpenTelemetry (OTel) and OpenInference standards, InsightFinder provides deep visibility into complex agentic workflows. Traces are streamed through the OTLP protocol (both gRPC and HTTP endpoints are supported) directly into InsightFinder for real-time trace analysis and performance monitoring.
Supported Integration Approaches
InsightFinder integrates with a wide range of tracing SDKs and frameworks. The following are commonly used approaches:
| SDK / Framework | Mechanism | Best For |
| Arize (OpenInference) | Automatic LLM instrumentation with child spans for each API call | Modern Python agents, cleaner auto-instrumented code |
| Temporal SDK | Built-in TracingInterceptor for distributed workflow tracing | Complex async workflows, Temporal-based orchestration |
| DDTrace (Datadog) | Lightweight auto-instrumentation via environment variables | Existing Datadog users, quick setup |
| Pure OpenTelemetry | Explicit manual span creation with full control | Any language/framework, maximum flexibility |
| iftracer-sdk | InsightFinder’s Python SDK with decorator-based tracing | Quick start, minimal code changes |
InsightFinder supports any additional SDK or library that exports traces in OpenTelemetry format (e.g., LangSmith, LlamaIndex instrumentation, etc.).
Quick Start: Generic OpenTelemetry Setup
The core pattern for sending traces to InsightFinder is the same regardless of which SDK you use—configure an OTLP exporter with InsightFinder authentication headers:
from opentelemetry import trace
from opentelemetry.sdk.trace import TracerProvider
from opentelemetry.sdk.trace.export import BatchSpanProcessor
from opentelemetry.exporter.otlp.proto.grpc.trace_exporter import OTLPSpanExporter
from opentelemetry.sdk.resources import Resource
otlp_exporter = OTLPSpanExporter(
endpoint=”<INSIGHTFINDER_OTEL_ENDPOINT>”,
headers={
“ifuser”: “<YOUR_USER>”,
“iflicensekey”: “<YOUR_LICENSE_KEY>”,
“ifproject”: “<YOUR_PROJECT>”,
“ifsystem”: “<YOUR_SYSTEM>”,
},
)
provider = TracerProvider(resource=Resource.create({
“service.name”: “your-agent-service”})
)
provider.add_span_processor(BatchSpanProcessor(otlp_exporter))
trace.set_tracer_provider(provider)
For detailed implementation guides for each SDK (including code examples, attribute specifications, and architecture diagrams), please refer to the TraceViewer Tool | InsightFinder Resources documentation.
Key Span Attributes for InsightFinder
Regardless of which SDK you use, the following attributes on spans enable InsightFinder to extract and analyze LLM interactions:
| Attribute | Purpose | When to Set |
| chat.prompt | Input prompt sent to the LLM | Before LLM call |
| chat.response | LLM’s generated response | After LLM call |
| chat.model | Model identifier used for inference | After LLM call |
| chat.prompt_tokens | Number of input tokens | After LLM call |
| chat.completion_tokens | Number of output tokens | After LLM call |
| chat.total_tokens | Total token count | After LLM call |
| x-session-id | Session or workflow correlation ID (optional) | Before LLM call |
| x-username | User identifier (optional) | Before LLM call |
3. Monitoring, Session Insights & Root Cause Analysis
3.1 Trace View: End-to-End Diagnostics & Issue Localization
The Trace View provides comprehensive observability across all agentic workflow executions, enabling teams to rapidly locate failures, performance bottlenecks, and quality issues.
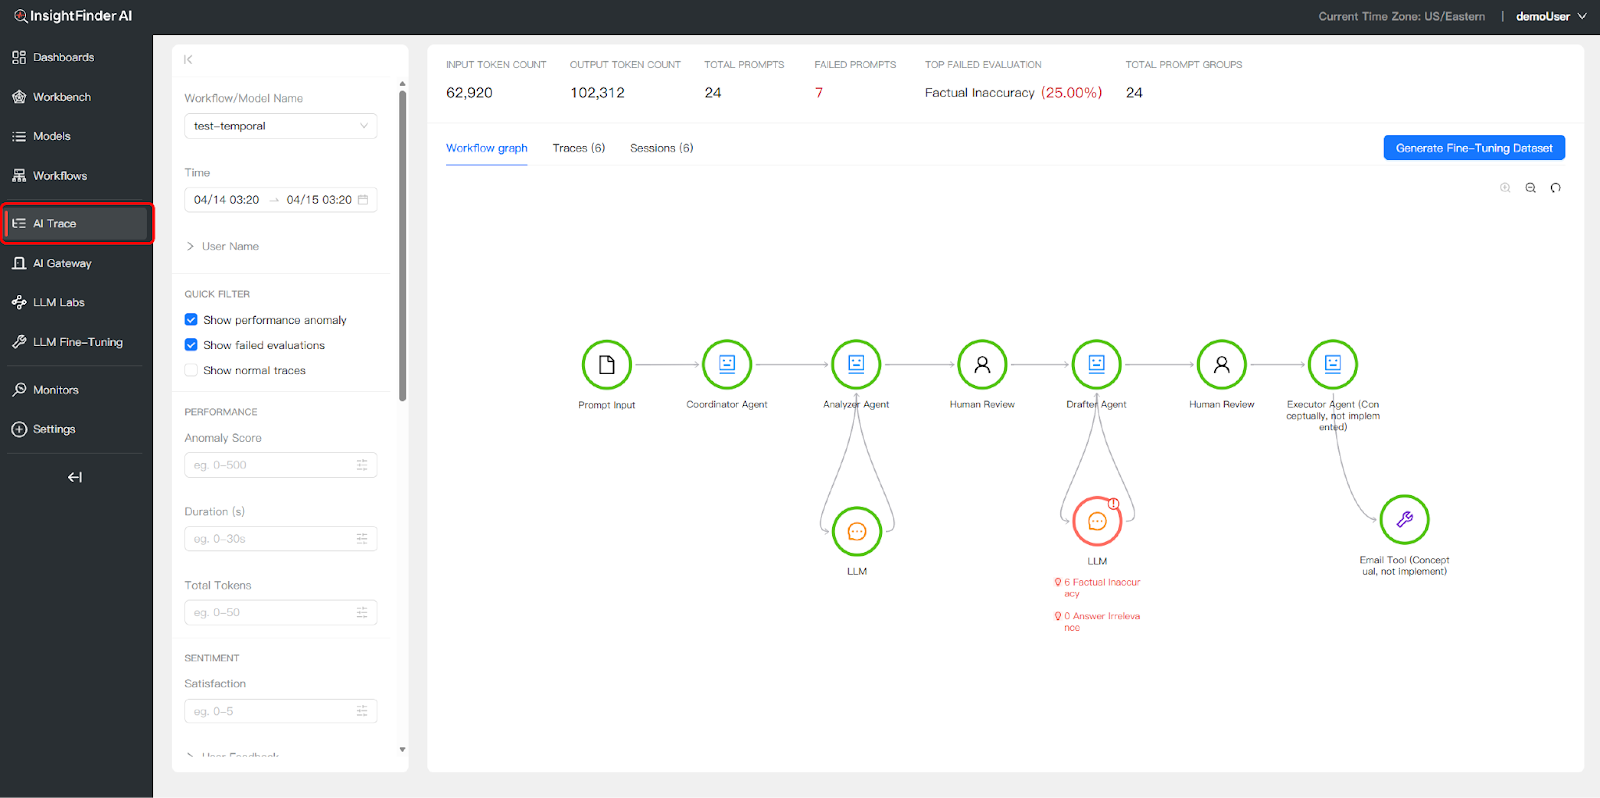
Accessing the Trace View
- Navigate to the “AI Trace” tab in the left navigation bar to access end-to-end execution logs.
- Select your workflow or model from the dropdown to load trace data for that specific agent system.
Workflow Graph Visualization
The Workflow Graph provides a visual map of your agent workflow with real-time execution status. Problematic nodes are highlighted directly on the graph, allowing you to instantly identify where failures occurred—such as factual inaccuracies in an Analyzer Agent’s output or a timeout in an Executor Agent’s tool call.
Granular Filtering
Use the left sidebar to filter traces and isolate specific issues across thousands of requests:
- Time Range: Set start and end dates to focus on a specific time window.
- Anomaly Score: Filter by anomaly severity. InsightFinder’s WatchTower engine uses patented unsupervised machine learning algorithms to automatically detect anomalies and assign a severity score—higher scores indicate more significant deviations from learned normal behaviour patterns. This ML-based approach requires no manual threshold configuration and continuously adapts to your system’s baseline.
- Duration: Isolate slow traces by filtering on execution time.
- Total Tokens: Filter by token consumption to identify unexpectedly expensive executions.
- Satisfaction: Filter by user satisfaction scores where available.
Dashboard Metrics
The top of the Trace View dashboard displays high-level aggregate metrics for the selected time range:
- Input/Output Token Counts: Total tokens consumed across all traces.
- Total Prompts: Number of LLM interactions recorded.
- Failed Prompts: Count of prompts that resulted in errors or missing responses.
- Top Failed Evaluation: The most common evaluation failure type (e.g., Factual Inaccuracy) with its percentage.
- Total Prompt Groups: Number of distinct prompt patterns detected.
Anomaly Types
InsightFinder automatically detects and categorizes four types of anomalies in trace data:
| Anomaly Type | Description |
| Trace Response Time | The full end-to-end trace took longer than the normal baseline or configured threshold. |
| Span Response Time | One or more individual spans within the trace exceeded normal duration, indicating a bottleneck in a specific agent or tool. |
| Span No Prompt Response | An LLM span did not return a response, indicating a model failure, timeout, or dropped connection. |
| Span Errors | The trace data contains spans with error flags set to true, indicating explicit failures during execution. |
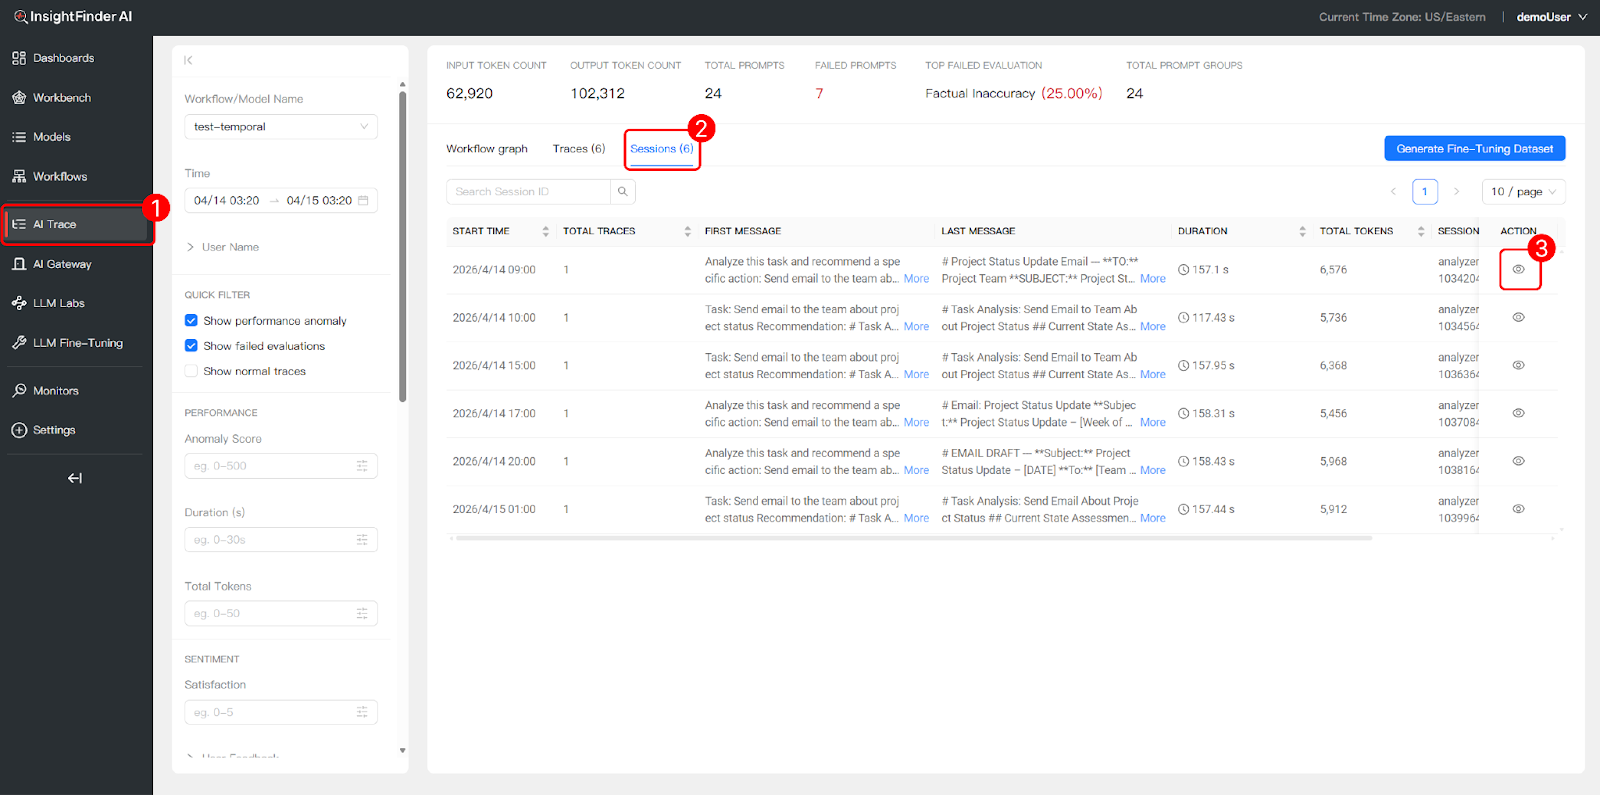
3.2 Trace Records: Granular Logs & Deep Diagnostics
The Trace Records view allows you to drill down into individual execution paths, inspect logic hierarchies, and analyze complex model interactions at the span level.
Comprehensive Trace Logs
Under the “Traces” tab, access a detailed list of every execution with columns for evaluation status, performance, start time, input/output previews, total tokens, and actions. Each row represents a single trace—a complete end-to-end execution of your workflow.
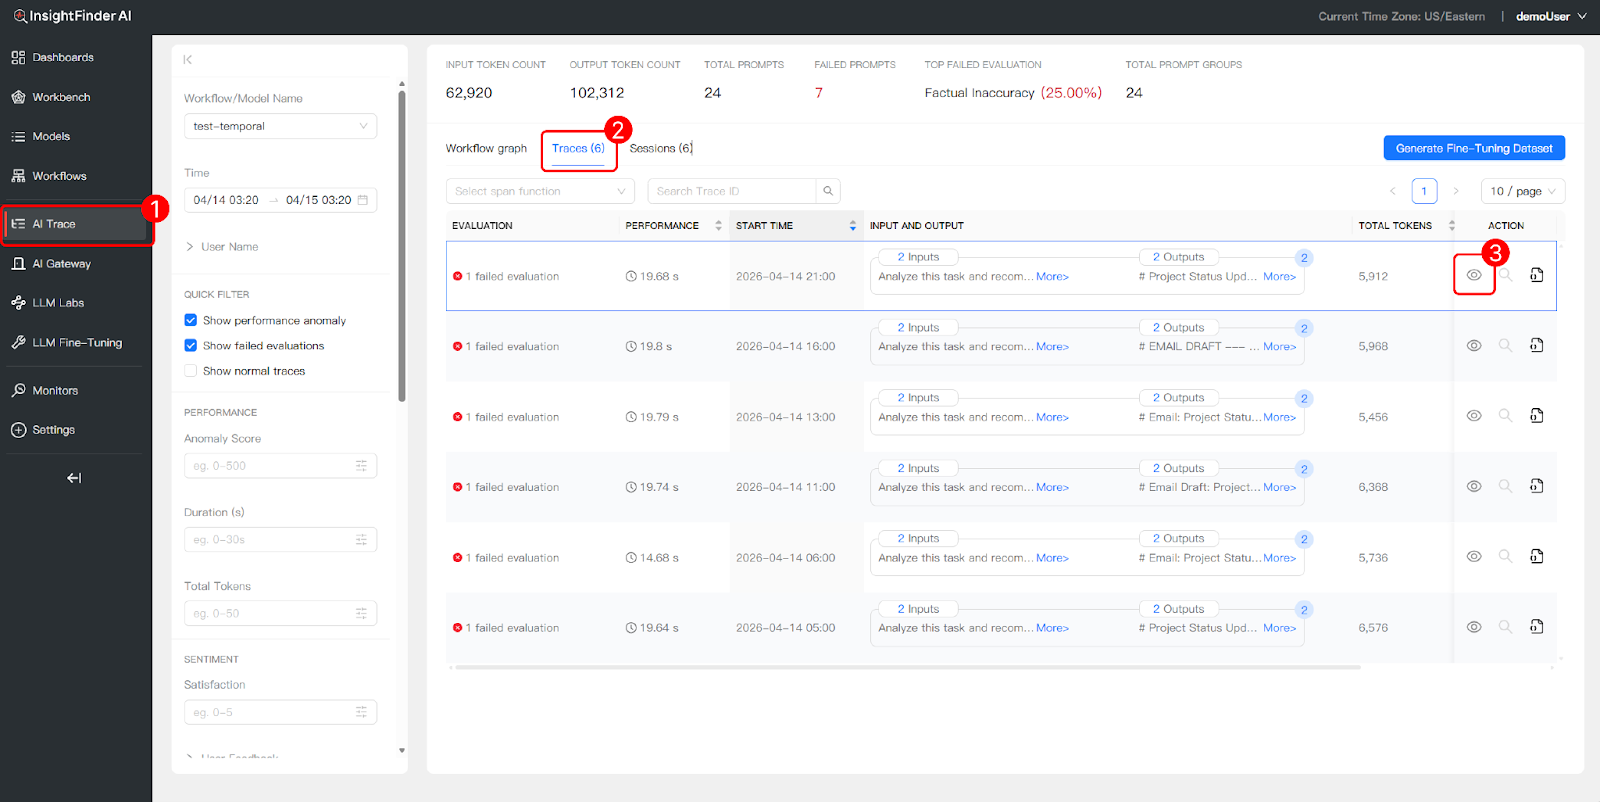
Input/Output Transparency
Preview the exact data exchanged during each step directly from the list view. For example, you can see the input prompt (“Analyze this task and recommend a specific action: Send email to the team about project status”) and the corresponding output (“Task Analysis: Send Email About Project Status…”) without opening the full trace detail.
Trace View Hierarchy
Opening the Trace Detail side panel reveals the parent-child relationship between spans, mapping out the precise execution sequence. For a multi-agent workflow, this hierarchy shows how the Coordinator Agent spawns child workflows for sub-agents, how each agent’s activities contain LLM calls, and where human review steps pause and resume execution.
A typical span hierarchy for the email drafting example looks like:
CoordinatorAgent (root span, 14.7s)├─ StartWorkflow:CoordinatorAgent
│ ├─ RunWorkflow:CoordinatorAgent
│ ├─ StartChildWorkflow:AnalyzerAgent
│ │ ├─ RunWorkflow:AnalyzerAgent
│ │ ├─ RunActivity:ai_analyze_task (5.3s)
│ │ │ └─ llm.anthropic.messages (5.2s) ← LLM call
│ │ └─ CompleteWorkflow:AnalyzerAgent
│ ├─ human.review_recommendation (1.0s)
│ │ └─ human.approve_recommendation
│ │ └─ SignalWorkflow:approve_recommendation
│ ├─ StartChildWorkflow:DrafterAgent
│ │ ├─ RunActivity:draft_email_content (3.9s)
│ │ │ └─ llm.anthropic.messages (3.9s) ← LLM call
│ │ └─ CompleteWorkflow:DrafterAgent
│ ├─ human.review_draft (1.0s)
│ │ └─ human.approve_draft
│ ├─ StartChildWorkflow:ExecutorAgent
│ │ ├─ RunActivity:execute_email_action (2.0s)
│ │ └─ CompleteWorkflow:ExecutorAgent
│ └─ CompleteWorkflow:CoordinatorAgent
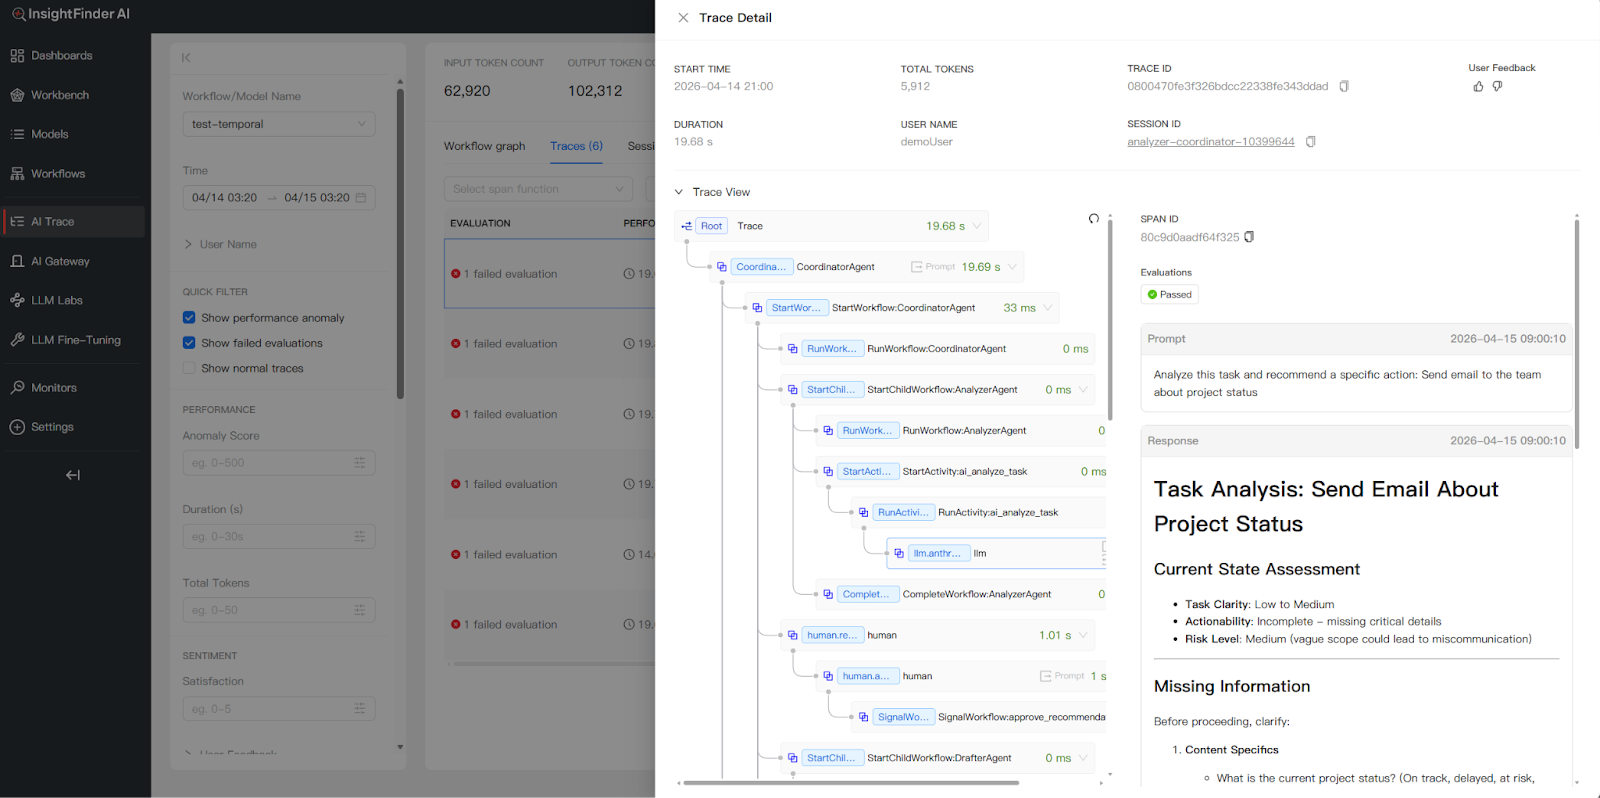
Granular Detail Inspection
For each span, you can inspect detailed metadata including:
- Trace ID and Span ID: Unique identifiers for correlation and debugging.
- Session ID: Links the trace to a broader multi-turn session.
- Prompt and Response: The exact input sent to and output received from each LLM call, with timestamps.
- Token Usage: Prompt tokens, completion tokens, and total tokens per span.
- Model Information: Which model was used for each LLM call (e.g., claude-haiku-4-5-20251001).
- Evaluation Scores: Automated evaluation results across multiple quality dimensions (see Evaluation Categories below).
- Temporal Metadata: For Temporal-based workflows, Workflow IDs and Run IDs are captured for cross-system correlation.
Evaluation Categories
InsightFinder provides automated evaluations across three major categories, each containing specific evaluation types that are applied to LLM prompts and responses:
| Category | Evaluation Types |
| Hallucination & Irrelevance | Factual Inaccuracy, Answer Irrelevance, Hallucination, Logical Inconsistency |
| Safety, Guardrails & Toxicity | Malicious Prompt, PII/PHI Leakage, Toxicity/Harmful Language, Topic Guardrails, Anomalous Outliers, Tone Detection |
| Bias | Socioeconomic Bias, Cultural Bias, Disability Bias, Religious Bias, Gender Bias, Political Bias, Racial/Ethnic Bias, Age Bias |
These evaluations run automatically on ingested trace data. Failed evaluations are surfaced in the Trace View and Trace Records, allowing teams to quickly identify quality issues such as factual inaccuracies, safety violations, or bias in model outputs.
Generate Fine-Tuning Dataset
From the Trace Records view, you can click the “Generate Fine-Tuning Dataset” button to export trace data (prompts, responses, and metadata) as a structured dataset for model fine-tuning and improvement.
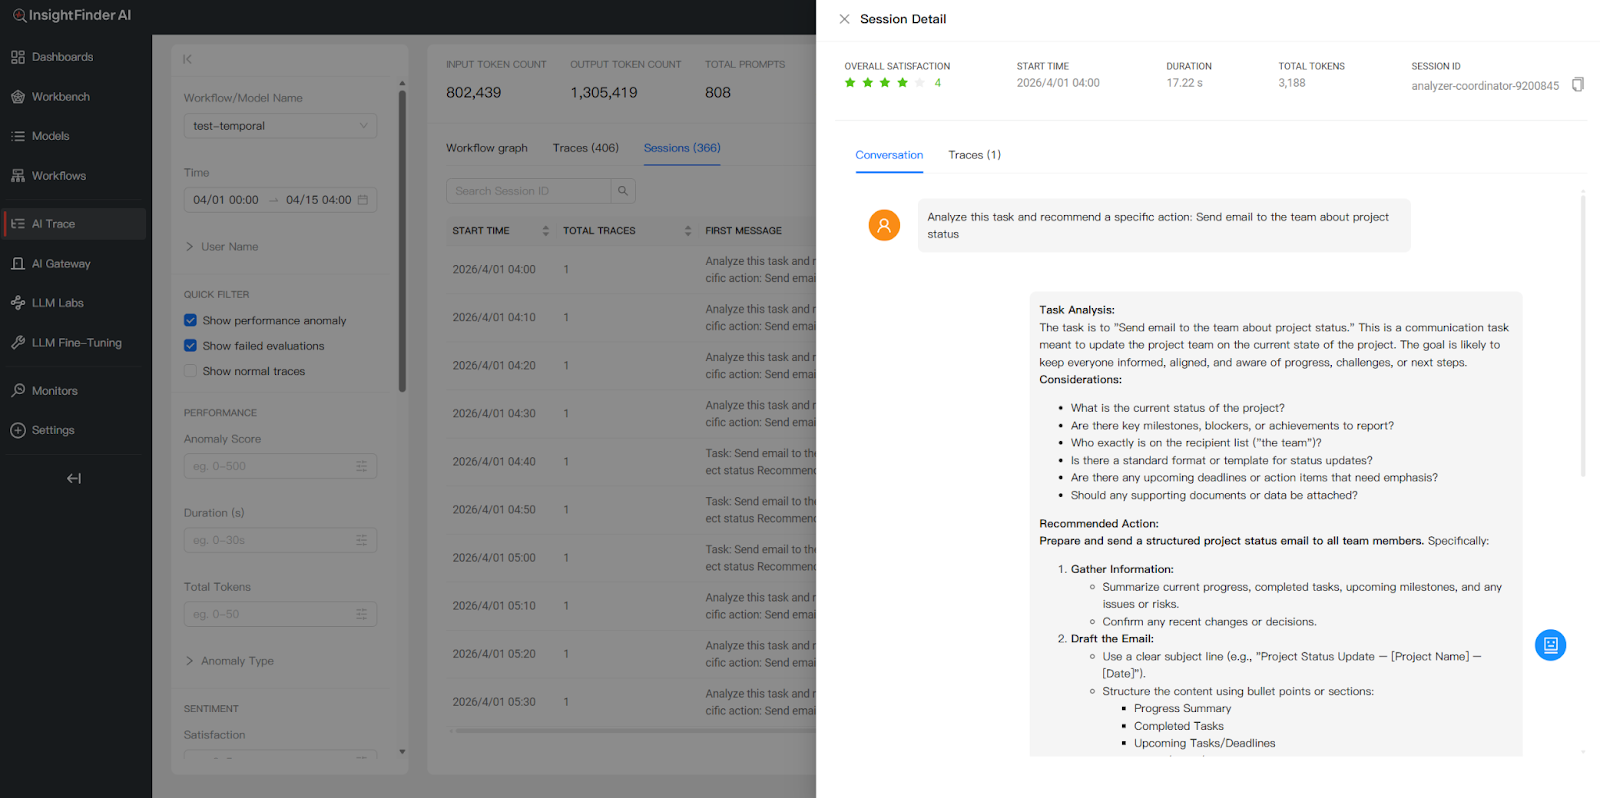
3.3 Session Logs: User-Centric Interaction Overviews
The Session view groups related traces into cohesive sessions, providing a holistic view of multi-turn, interactive dialogues between users and the multi-agent system.
How Sessions Are Grouped
A session represents a single user’s interactive dialogue with the multi-agent system. Within a session, a user may issue multiple requests—each of which generates its own trace (including all intermediate sub-agent prompts and responses). For example, if a user asks the Coordinator Agent to send 10 different emails in one conversation, that produces 10 individual traces, but all 10 are grouped under a single session by the shared x-session-id attribute. This per-user, per-conversation grouping makes it easy to follow the complete arc of a user’s interaction from start to finish.
Message Context Preview
For each session, you can inspect the First Message (the initial user request that started the session) and the Last Message (the agent’s final output) to quickly grasp the user’s intent and the end result without opening every individual trace.
Session-Level Performance Metrics
Track aggregate metrics per session to evaluate interaction efficiency:
- Duration: Total cumulative time across all traces in the session.
- Total Tokens: Aggregate token consumption for all LLM calls within the session.
- Total Traces: Number of individual trace executions within the session.
- Overall Satisfaction: A composite score calculated by InsightFinder’s algorithms that combines user feedback (thumbs up/down, ratings) with automated evaluation results (hallucination checks, safety scores, bias detection, etc.) to produce a single session-level quality metric.
Session Detail View
Opening a session’s detail panel shows both a Conversation view and a Traces view:
- Conversation View: Presents the sequential flow of the dialogue in a readable format—showing how each task was analyzed, what recommendations were made, and what actions were taken. This makes it easy to review the complete end-to-end user experience as a narrative.
- Traces View: Lists the individual trace records that make up the session. Each trace shows its evaluation status, duration, token count, and whether any anomalies or failed evaluations were detected.

Using Sessions for Debugging & Improvement
The Session view is particularly valuable for debugging multi-turn workflows. Teams can identify whether a specific trace within a session triggered an anomaly or failed an evaluation, then drill into that trace’s span hierarchy to pinpoint the root cause. This is especially useful for catching issues that only manifest across multiple interactions—such as context degradation over a long session, inconsistent agent behavior between turns, or escalating token costs as conversation history grows.
4. Sensitive Data Filtering
InsightFinder includes built-in sensitive data filtering to help protect privacy and comply with regulatory requirements such as GDPR and HIPAA. When enabled, the sensitive data filter automatically detects and masks sensitive information within trace data before it is displayed or processed.
How It Works
- Configuration: Sensitive data filtering is enabled by setting sensitiveDataFilterEnabled: true in your TraceServer configuration. For SaaS deployments, this is managed by the InsightFinder team. Custom detection patterns can be defined using regular expressions under sensitiveDataRegex.
- Detection: The filter scans incoming trace data for patterns matching sensitive information, including Social Security Numbers (SSNs), physical addresses, medical IDs, and other personal identifiers.
- Masking: When sensitive data is detected, it is automatically masked or redacted from the trace output, ensuring that such information is never exposed in the UI, logs, or exported datasets.
Example: SSN Filtering
Without the sensitive data filter enabled, an SSN such as “123-456-7890” appearing in a trace prompt or response would be fully visible in the Trace Detail view. With the filter enabled, the SSN is automatically detected and masked, and the agent’s response reflects that sensitive data handling policies are enforced.
Benefits
- Compliance: Helps meet privacy regulations including GDPR, HIPAA, and organizational data protection policies.
- Security: Prevents accidental exposure of personally identifiable information (PII) in trace data, dashboards, and exported datasets.
- Customizable: Easily extend filtering to new data types by adding regex patterns to the configuration—no code changes required.
5. Additional Resources
For more detailed information on specific topics covered in this document, please refer to the following resources:
- TraceViewer Tool | InsightFinder Resources: Complete SDK integration guides with detailed code examples for Arize, Temporal, DDTrace, Pure OpenTelemetry, iftracer-sdk, and more.
- Model Creation Documentation: Step-by-step guide for creating models in InsightFinder, including trace data source configuration.
- InsightFinder LLM Labs: Automatic trace project creation and LLM monitoring for LLM Labs users—no manual setup required.
From the Blog


See how InsightFinder helps your team deliver reliable services across every layer of the stack
Take InsightFinder AI for a no-obligation test drive. We’ll provide you with a detailed report on your outages to uncover what could have been prevented.
