Project Configuration
1. Datadog API Key – You can to go below link in your account – https://app.datadoghq.com/organization-settings/api-keys
Select “API Keys” on the left menu and create a “New Key”

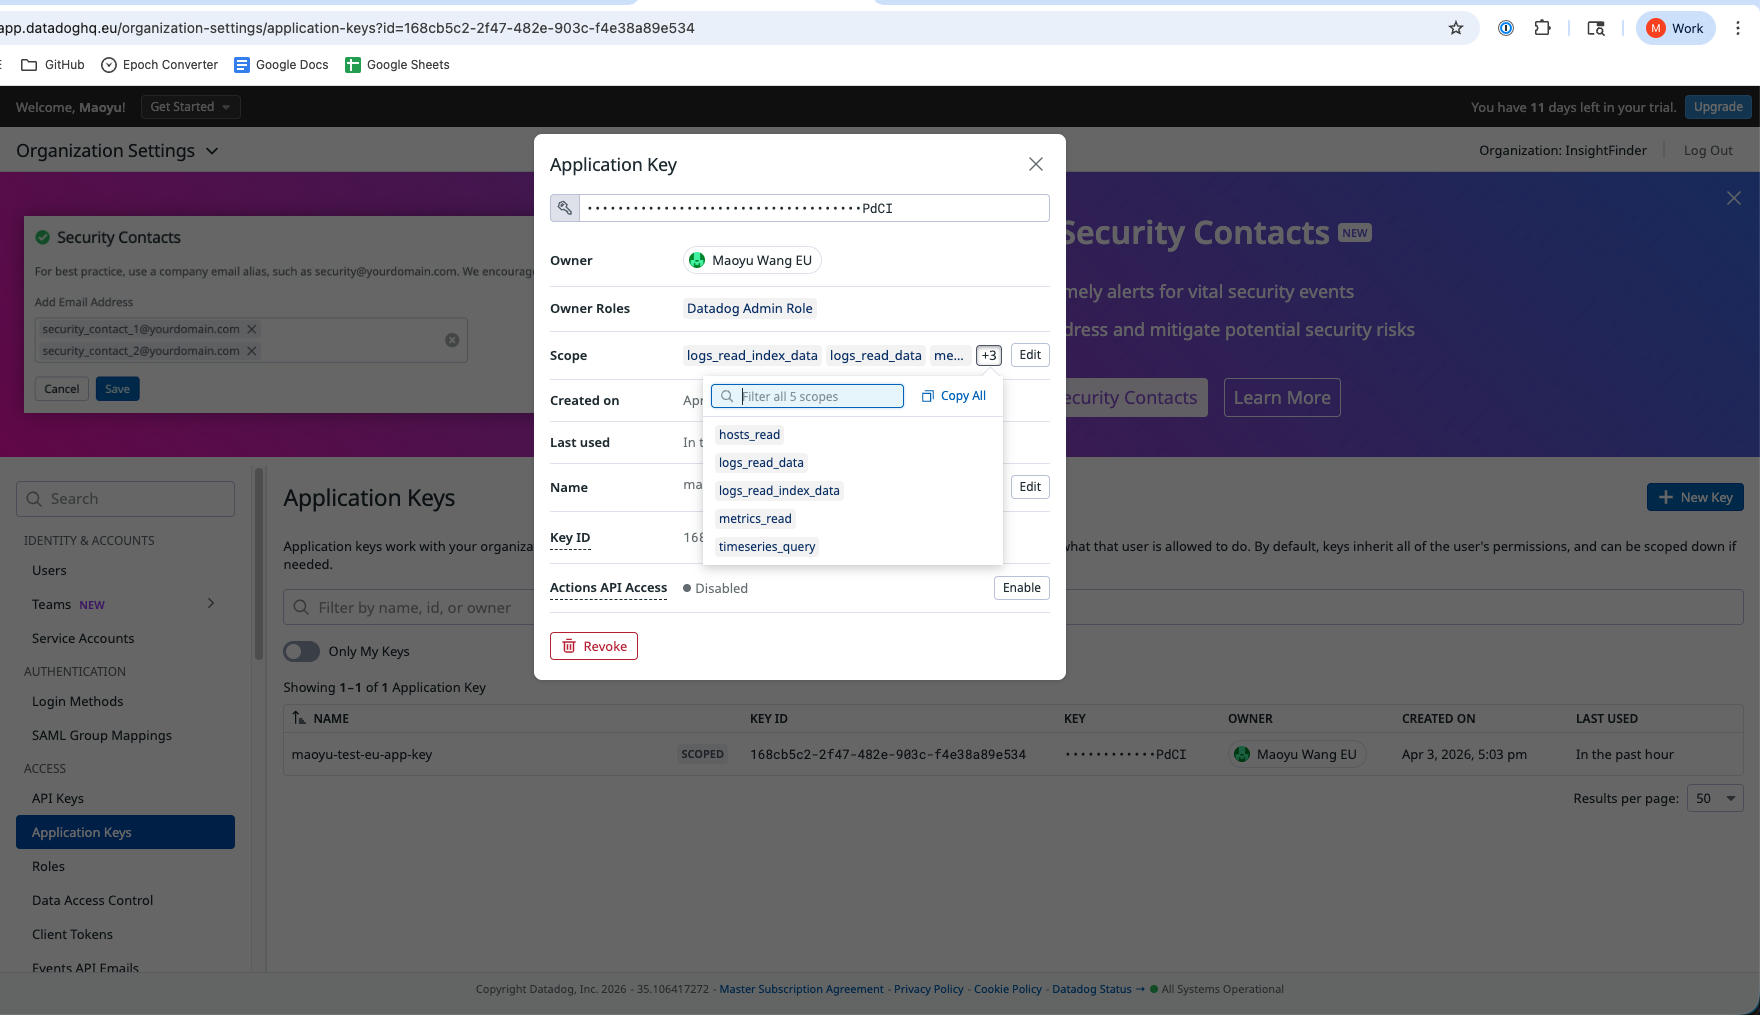
2. Datadog Application Key and Key ID – You can to go below link in your account – https://app.datadoghq.com/organization-settings/application-keys
Select “Application Keys” on the left menu and create a “New Key”
3. Select the necessary privileges
Please add the following items to the Scope of the application key:
- metrics_read
- hosts_read
- timeseries_query
- logs_read_data
- logs_read_index_data
Project Creation – Metric:
1. Go to “Settings”->“System Settings”->”Add New Project” Select “DataDog” from the list and click on
2. “Create Project”/”Create Projects in Batch”.
3. Metric Project:
3.1 Provide “API Key” and “Application Key” from the DataDog account and click “Verify”, and choose “Data Type” Metric.
3.2 On the next page, select the Metrics you want to source
3.3 You can also configure the metrics for KPI if required for your use case.
3.4 Select Component name tag:
3.5 Use Tag expression to select instance
3.6 Select host or host name as instance name
3.7 Then on the next page, you can type in the “Project Name” and “System Name” and click on Register.
3.8 Once a project is successfully created, you will see a message like below.
3.9 You can go to the “Metric Analysis” page and check the data coming in there in the line chart
Project Creation – Log/Event:
1. Go to “Settings”->“System Settings”->”Add New Project”
2. Select “DataDog” from the list and click on “Create Project”/”Create Projects in Batch”.
3. Log/Event Project:
3.1 Provide “API Key” and “Application Key” from the DataDog account and click “Verify”, and choose “Data Type” Log or Event.
3.2 select Fields to Analyze:
3.3 input instance key and Filter Query(Log Format: {tag}:{value}, Event Format: tags={tag}:{value});
3.4 Select Component Name
3.5 Then on the next page, you can type in the “Project Name” and “System Name” and click on Register.
3.6 You can go to the “Log/Trace Analysis” page and check the data coming in there in the line chart
4. You are all set to receive DataDog integration with InsightFinder and start to use InsightFinder AI engine for Incident Investigation and Prediction.
Project Creation – Trace:
-
- Overall architecture
- Go to “Settings”->“System Settings”->”Add New Project”
- Select “Custom” from the list, choose “Instance Type” Private Cloud, “Data Type” Trace and “Agent Type” Log Streaming. Input your project name and system name and click “Finish”
4. Install and configure Open Telemetry collector
4.1 Download from https://github.com/open-telemetry/opentelemetry-collector-releases:
curl --proto '=https' --tlsv1.2 -fOL https://github.com/open-telemetry/opentelemetry-collector-releases/releases/download/v0.95.0/otelcol-contrib_0.95.0_linux_amd64

.tar.gztar -xvf otelcol-contrib_0.95.0_linux_amd64.tar.gz
4.2 Create a new file called collectorconfig.yml:
receivers: datadog: endpoint: # URL:PORT the collector is running on, e.g. localhost:8731processors: batch:exporters: debug: verbosity: detailed datadog: api: key: # Your datadog backend API key otlphttp: endpoint: https://stg.insightfinder.com/api # Updated to include http:// scheme tls:

insecure: false

headers:

"ifproject": "maoyu-test-trace"

"ifuser": "maoyuwang"

"iflicense": "7a51fc392d539176d76922c0ed091e834f4fa553"

service: # telemetry: # logs: # level: DEBUG extensions: [] pipelines: traces: receivers: [datadog] processors: [batch] exporters: [otlphttp, datadog]
4.3 Start collector:
./otelcol-contrib --config=./collectorconfig.yml
5. Install and configure datadog agent:
5.1 Download and install:
DD_API_KEY=<DATADOG_API_KEY> DD_SITE="datadoghq.com" bash -c "$(curl -L https://s3.amazonaws.com/dd-agent/scripts/install_script_agent7.sh)"
5.2 Update datadog agent configuration file /etc/datadog-agent/datadog.yaml as follows:
api_key: #your datadog api keyobservability_pipelines_worker: traces: enabled: true url: "http://127.0.0.1:8731" # URL:PORT the OpenTelemetry collector is running on
5.3 Set the environment variable to identify the project where trace data is stored:
export DD_TAGS=if_project:<InsightFinder Project Name>,if_user:<InsightFinder username Name>,if_license:<User license key>
You can find license key under account profile:
5.4 Restart datadog agent: sudo systemctl restart datadog-agent
6.Collect tracing data from Python application:
sudo apt-get install python-pippip install flaskpip install ddtraceExport DD_TAGS=if_project:<project_name>,if_user:<username>,if_license:<licensekey>ddtrace-run python <YOUR_PYTHON_SCRIPT>
Example Application: https://docs.datadoghq.com/getting_started/tracing/
There are two ways to set up the project info:
- Set in datadog agent config file (higher priority)
- Set in Opentelemetry config file
Push Notification:
1. Go to “Settings”->“External Service Settings”. Click on “DataDog”.
2. Pop up will open up where you click on “Add New”.
3. Select the “System Name” from the list that you want to enable it for and provide API Key, App Key, App Id (Application Key ID in DataDog). Next section talks about how to retrieve that information from DataDog.
4. You are all set to send InsightFinder predicted incidents to DataDog.
5. You will start seeing incidents in the DataDog under Monitors -> Incidents. These will be under the DataDog service for which the keys were used to configure in InsightFinder.


