Three Phrases. Three Completely Different Products. One Very Confused Market.
If you’re evaluating observability tools for your AI systems, you’ve almost certainly encountered all three phrases: “AI observability,” “observability for AI,” and “AI-driven observability.” Vendors use them interchangeably. Analysts use them loosely. And buyers end up purchasing tools that solve the wrong problem.
This post is a field guide to what each phrase actually means, what it covers, and how to tell whether a vendor claiming to offer one actually delivers on it.
First, a Diagnosis (and an Apology!)
I work in product marketing for a company in this space. So I’m, at least partially, responsible for the mess you’re navigating. Not this specific mess, necessarily, but the broader one: the industry’s habit of coining multiple phrases that sound like synonyms, papering them across product pages and analyst briefs, and leaving buyers to sort out the differences. On behalf of the category, I’m sorry.
The cost of the confusion isn’t just wasted time in vendor demos and bake-offs. The cost hits real budgets allocated to tools that answer the wrong questions. Teams running production AI systems invest in an “AI-ready observability” tool only to find that “AI-ready” means a dashboard for token counts sitting on top of infrastructure telemetry that has nothing to say about model behavior. Or they invest in tools that show the AI team how the models are performing during development, but fall woefully short once the AI applications roll out to production. Or they invest in observability that’s “AI-driven” assuming it means their AI applications are being observed, when it actually means AI is being used to help observe everything else.
This results in observability gaps in all the wrong places. AI systems often fail silently, in production, without an error code to chase. And when they do, that’s when the finger pointing begins. The first step is understanding which tools do what. Then, you ensure your team has tools that don’t expose the gaps. To do that, you need clarity on who’s doing what and what to look for.
This post is my attempt at partial restitution. Three terms, three clear definitions, and a practical test for telling the difference when you’re in vendor evaluations.
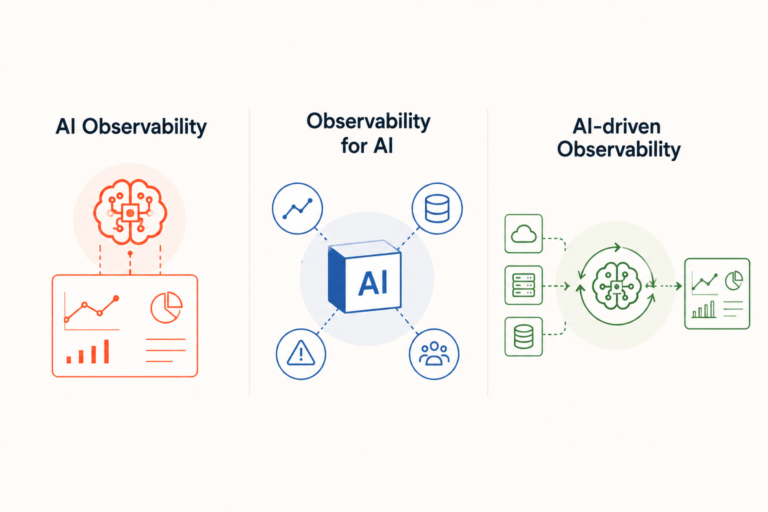
“AI Observability”: Watching the Model
The most specific of the three phrases, “AI observability” has a relatively narrow and useful definition. It asks a focused question: Can I understand why my LLM, model, RAG application, or AI agent behaved the way it did?
The signals it cares about are the ones native to non-deterministic AI systems: prompts and completions, token usage and cost, latency, safety evaluations, model drift, retrieval quality (for RAG pipelines), and agent or tool-call traces. IBM’s framing is apt: LLM observability is about collecting real-time data around LLM application behavior, performance, and outputs.
This is the innermost layer of the problem. Without it, you’re flying blind on the thing your users actually interact with. Whether a response was grounded in retrieved context, whether a safety classifier flagged a completion, whether token costs are spiking because of a poorly written system prompt, etc.
These are the questions that “AI observability” is built to answer. Think of it as the equivalent of application-level tracing, but for systems where “the application” is a language model making probabilistic decisions.
“Observability for AI”: Watching Everything Else, Too
“Observability for AI” is a wider-angle lens, and the distinction matters enormously in practice. Instead of asking “what did the model do,” it asks: What observability capabilities do AI-native systems actually require to stay reliable?
The answer is: a lot more than just the model. A production AI application is not just an LLM. It’s a composition of vector stores, prompt templates, orchestration frameworks, retrieval pipelines, data sources, APIs, application code, infrastructure, evaluation pipelines, security controls, and user journey telemetry. Any of those layers can fail. Most failures in production AI systems aren’t clean, obvious errors, and that’s what makes this category important.
Here’s where it gets messy. If you have great traditional observability, then you live in a world where traditional service failures mostly announce themselves. A service crashes. Latency spikes. Error rates climb. Your dashboards light up. You know that there’s an obvious problem. The only real factor is how quickly you’re able to detect, mitigate, and respond.
AI failures are more insidious. The API returns 200 OK. Latency is normal. Your SLOs look green. And your application just gave a user a toxic, hallucinated, noncompliant, or quietly wrong answer that won’t show up in any metric you’re already collecting. It could be days, weeks, or even months before you realize there’s a critical service failure.
If we made a Venn diagram of overlapping concerns, then “AI Observability” and “Observability for AI” would be two concentric circles. “AI observability” is the inner circle and “observability for AI” is the larger circle that contains it. It should include everything that “AI observability” covers—like LLM evaluations, prompt and completion patterns, guardrails, agent traces, etc—plus the deterministic infrastructure surrounding those models: latency, error rates, throughput, resource utilization, and the health of every service in the chain.
The challenge for buyers is evaluating whether a traditional observability vendor (especially those new to the AI space) have actually built useful and sophisticated enough “AI observability” into their “observability for AI” offering, or whether they simply added a dashboard for token counts on top of what they already had.
That gap is real. It’s confusing. And it’s where tool evaluations tend to go wrong. If you make the wrong choice, you won’t find out until you’re already dealing with angry customers in production.
“AI-Driven Observability”: AI as the Observer, Not the Observed
If the waters weren’t already murky enough, this is where the direction reverses. In the first two categories, AI is the subject of observation. In “AI-driven observability,” AI is doing the observing.
The closest reference point to this is AIOps, which has historically meant using machine learning to help teams manage the volume and complexity of IT operations. Event correlation, alert grouping, noise reduction: these were the classical AIOps use cases, and for years they were accomplished with relatively simple algorithms.
“AI-driven observability” goes considerably further. It includes true anomaly detection across high-dimensional telemetry, causal root-cause analysis (not just correlation), predictive alerting before incidents materialize, remediation suggestions, runbook automation, and natural-language querying across telemetry data.
Where AIOps shines is delivering on promises like “we can group these 400 alerts for you.” In comparison, AI-driven observability delivers on “detecting an anomaly 47 minutes before the incident, tracing it to a memory leak in a specific service, and telling you which runbook applies.” The difference in operational leverage is substantial, particularly as system complexity grows with every new AI component added to production environments.
A Practical Lens for Buyers
So which one are you looking at? Here’s a simple test. The three phrases map to three distinct operational questions:
“AI observability” answers: Are my non-deterministic AI agents, LLMs, ML models, and AI applications behaving correctly, safely, reliably, and cost-effectively?
“Observability for AI” answers: Are the deterministic systems surrounding those AI applications behaving correctly, safely, reliably, and cost-effectively?
“AI-driven observability” answers: Can AI help me understand, debug, and operate all of these systems faster?
A team running production AI applications needs answers to all three questions. Unfortunately, the vendor ecosystem rarely makes it easy to know which of those a given tool actually addresses.
The right evaluation question to bring to any vendor demo is direct: “Show me how you handle an AI failure that doesn’t produce an error code.” Specifically, ask them what happens when an agent completes its tool calls successfully, latency is within bounds, and the output is still wrong.
If the answer is “we’d see that in our LLM traces,” they’ve answered the first question. If the answer involves the entire system, the retrieval pipeline, the prompt template version in play, and what changed upstream — they’re answering the second.
If an AI agent surfaced the issue before a human noticed it, validated a hypothesis against production telemetry, and suggested a fix, that’s the third.
InsightFinder Covers All Three
InsightFinder is built to answer all three questions from a single platform. On the AI observability side, multi-agent tracing gives teams visibility into every step an agent takes, including tool calls, retrieval decisions, and model outputs.
On the broader “observability for AI” side, InsightFinder’s Unified Intelligence Engine ingests telemetry from across the stack, connecting model behavior to the infrastructure and application layers that surround it.
AI-driven observability is foundational to InsightFinder’s design: ARI, the platform’s operational AI agent, performs root-cause analysis grounded in production evidence, detects anomalies before they become incidents, and helps teams resolve issues in a fraction of the time traditional workflows allow.
The terminology confusion in this market is real, and it’s costly. Teams end up with point tools that only answer one of the three questions, or with traditional observability platforms that handle the deterministic infrastructure well but have nothing meaningful to say when the model goes sideways. Understanding which question each phrase answers is the first step to buying the right solution. The second step is making sure your vendor can demonstrate all three, not just talk about them.
Cut through the confusion and noise
Like our AIOps, MLOps, and LLMOps terminology explainer, this post was written to cut through vendor language and give practitioners a cleaner map of the landscape. If you found it useful, the practitioner’s guide to AIOps, MLOps, and LLMOps covers adjacent territory.
If you want tools that help you do the same with your AI-native applications in production, contact us for a demo.
