Server Setup
We need to disable sanitizing html features in Grafana to display html contents correctly.
We can simply add the following configurations to the grafana.ini configuration file and restart Grafana server.
[panels]

disable_sanitize_html = true
Panel Setup
Search for a new Text visualization in the panel library.

Update the Mode to HTML.

Paste the iFrame HTML script in the HTML block
Example HTML iFrame script:
<iframe width=”100%” height=”600px” id=”heatmapFrame” src=”{iFrame source link}”></iframe>
<script>
var iframe = document.getElementById(“heatmapFrame”);
function setIframeSize (){
iframe.style.height = iframe.parentElement.offsetHeight-5 + “px”;
iframe.style.width = iframe.parentElement.offsetWidth + “px”;
}
// Call setIframeHeight when the iframe content is loaded
iframe.onload = setIframeSize;
// Also, call setIframeHeight when the window is resized
window.addEventListener(“resize”, setIframeSize);
</script>
- Causal Graph
The Causal Graph visualizes the relationship between incidents and affected components or devices.
It helps identify the root cause by showing which components are influencing others during an incident.
Each node in the graph represents a component.
Directed edges (arrows) show the causal relationships – for example, which service caused an anomaly in another.
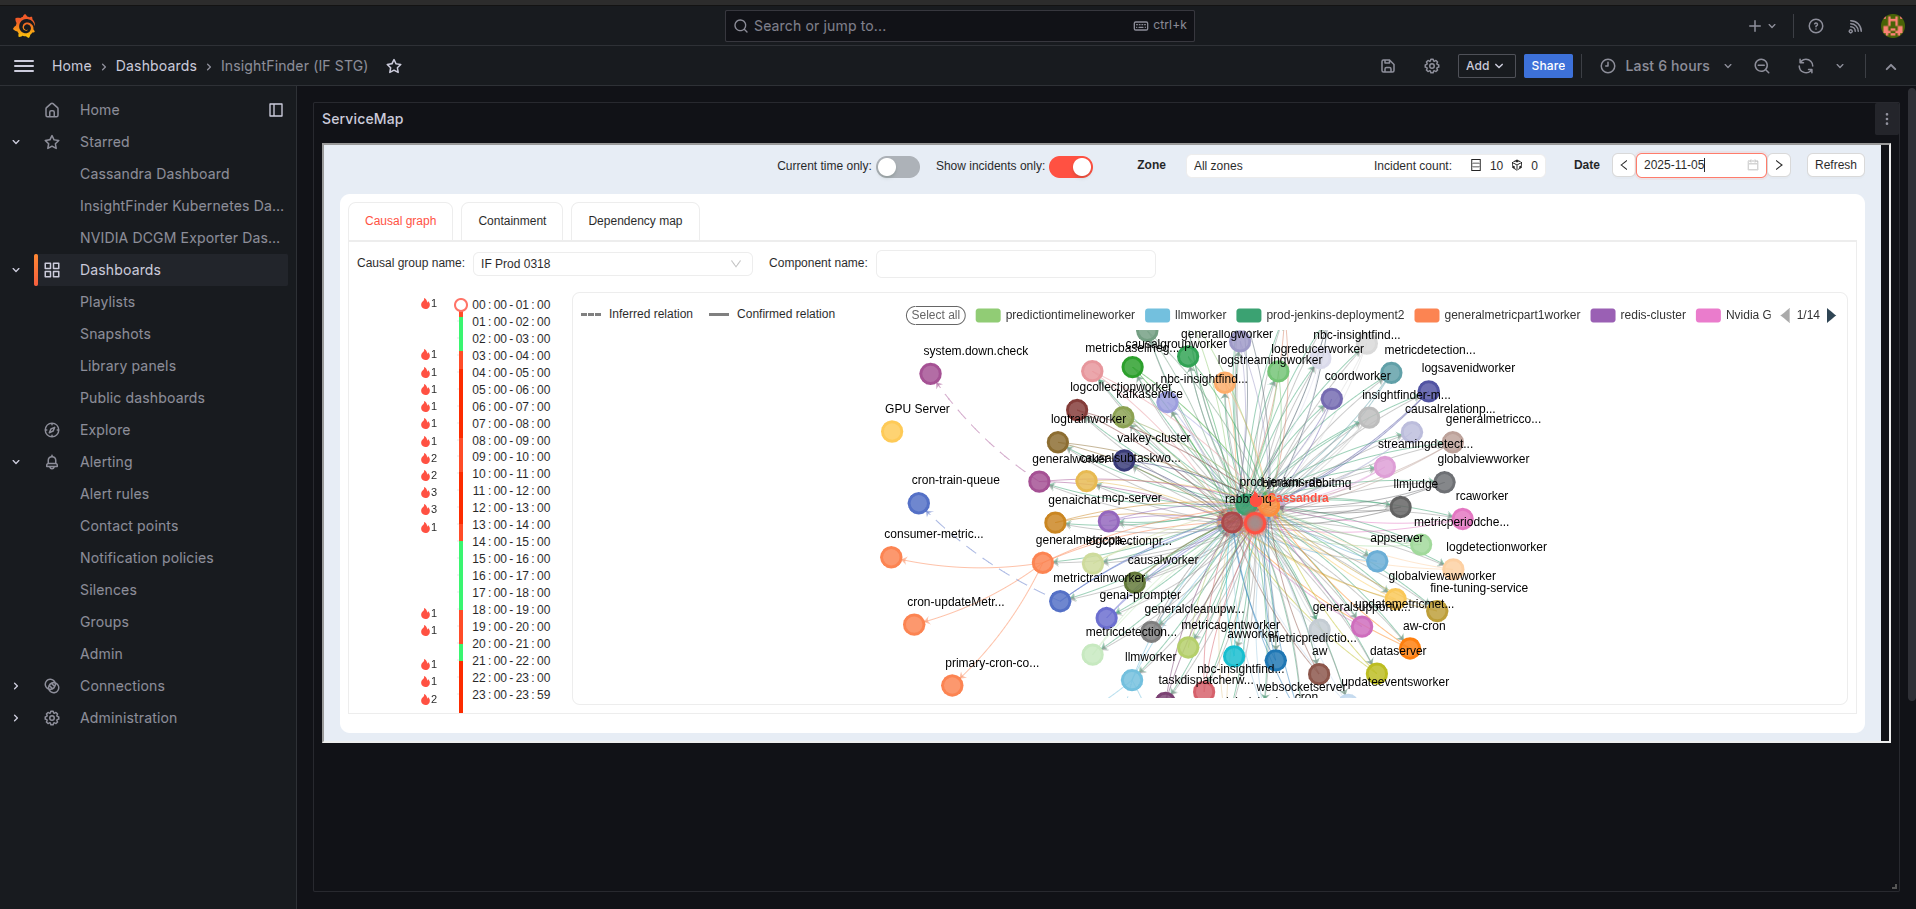
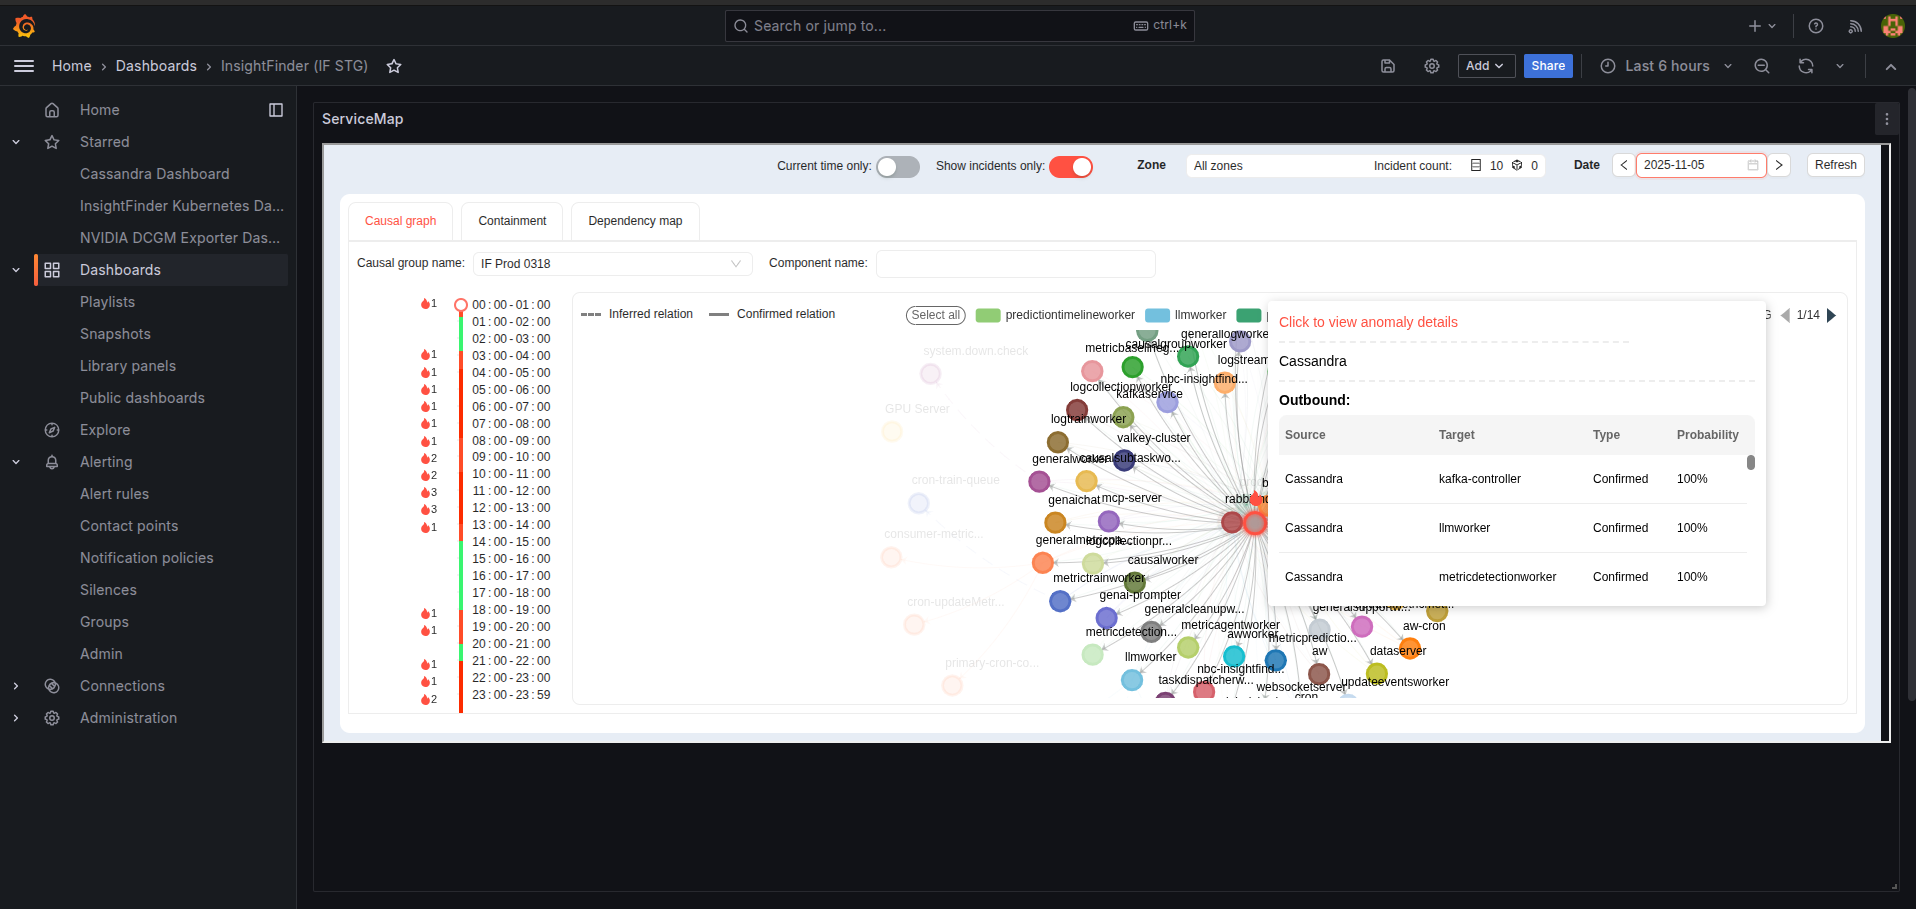
When hovering over any component, you can view a detailed table showing inbound and outbound relationships:
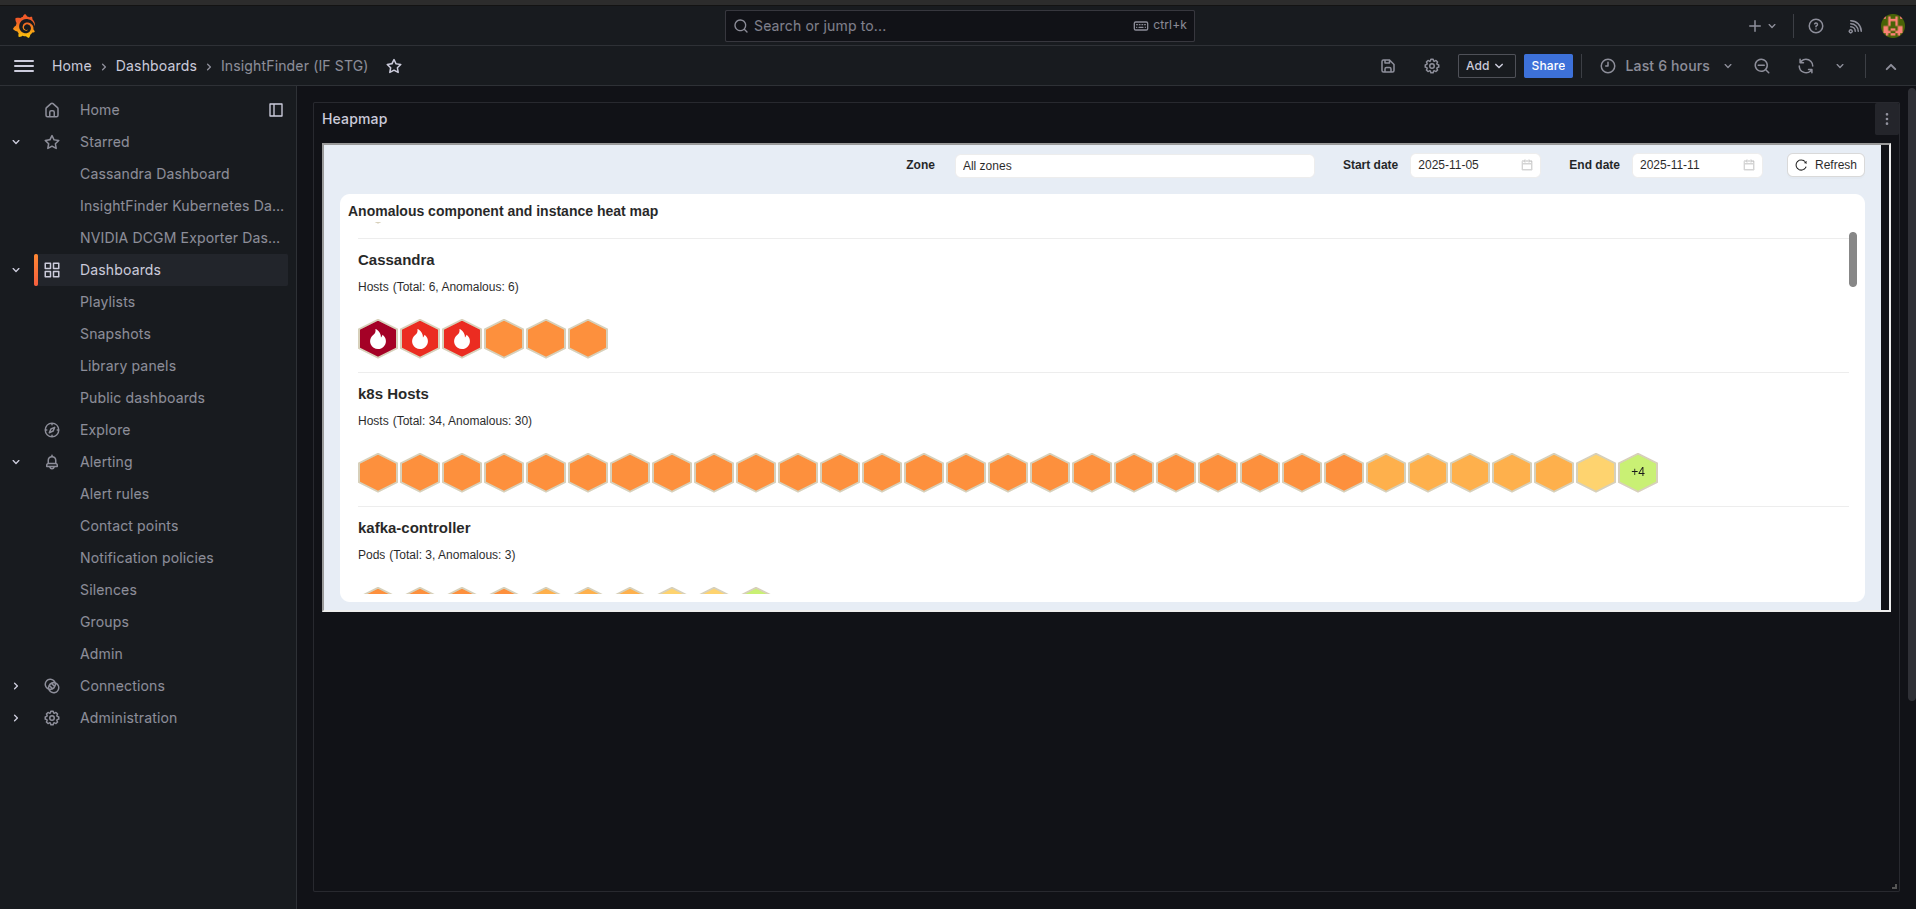
- Containment
The Containment section summarizes the health status of instances and the overall anomaly severity within a monitored system or cluster.
It groups components based on their health levels – helping assess how widespread the problem is.
You can also filter the view to show only incidents, allowing you to focus on currently active incidents.

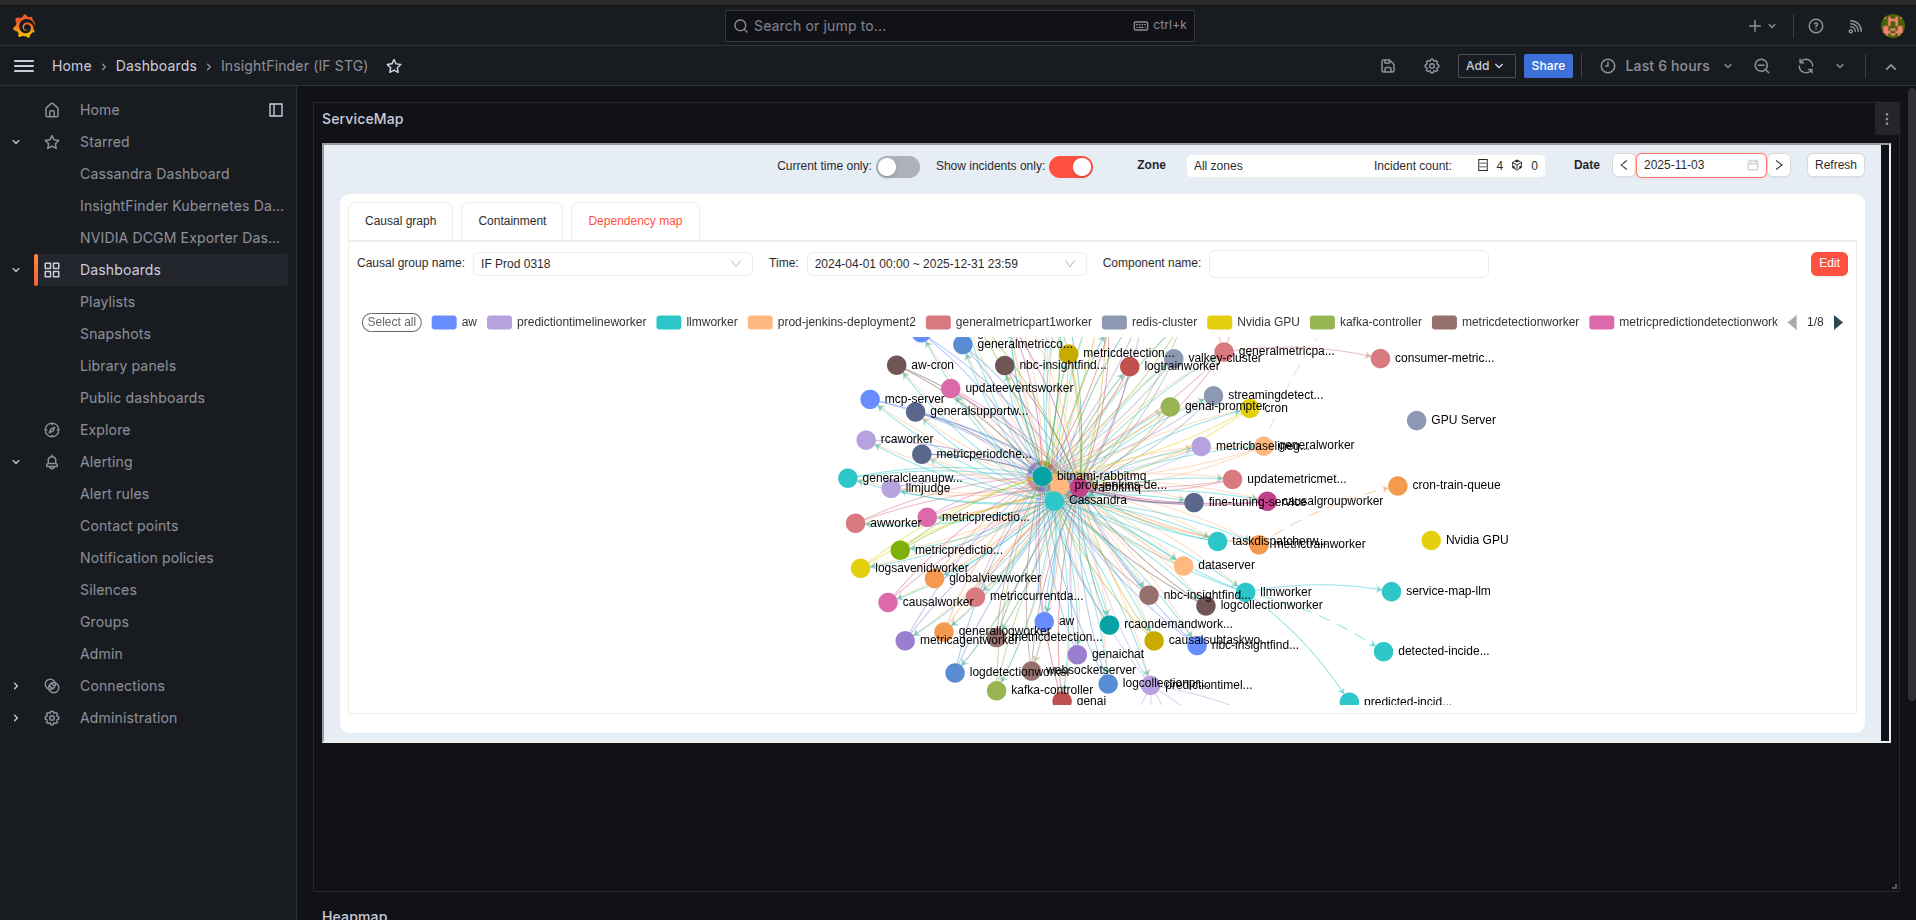
- Dependency map
The Dependency Map represents how different components are interconnected and dependent on one another.
It helps visualize system architecture and data flow, making it easier to identify upstream and downstream dependencies for any service.
Please refer to the iFrame setup document to get the iFrame component URL.
Example HTML iFrame script:
<iframe width=”100%” height=”600px” id=”heatmapFrame” src=”{iFrame source link}”></iframe>
<script>
var iframe = document.getElementById(“heatmapFrame”);
function setIframeSize () {
iframe.style.height = iframe.parentElement.offsetHeight-5 + “px”;
iframe.style.width = iframe.parentElement.offsetWidth + “px”;
}
// Call setIframeHeight when the iframe content is loaded
iframe.onload = setIframeSize;
// Also, call setIframeHeight when the window is resized
window.addEventListener(“resize”, setIframeSize);
</script>
The Anomalous Component and Instance Heatmap provides a quick visual overview of which components and instances are exhibiting anomalous behavior within the monitored system.