With AI applications, any single request can fan out into session state checks, prompt assembly, tool calls, vector lookups, HTTP hops across services, and a flurry of model executions. When something goes wrong, using logs alone will almost never give you the full story. However, distributed traces can.
In this post, we show you how to use new InsightFinder AI tracing features that make distributed traces the center of AI debugging, demonstrate how they plug into everyday workflows, and share a practical way to move from incident to root cause without losing the plot.
AI Tracing overview
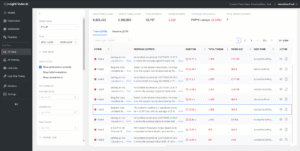
In InsightFinder AI observability platform,the AI Traces page is your home for understanding how prompts flow through your AI eco-system. Up top you’ll see the pulse of your workload: input and output tokens, total prompts, failed prompts, and the most common evaluation issues.
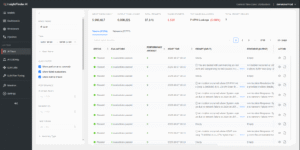
The AI Traces overview screen shows KPIs for tokens, total prompts, failed prompts, and most common evaluation issues at the top, plus filter controls for status and anomaly types to narrow the trace set
Filters allow you to narrow down the data to focus on specific areas, such as failed evaluations, performance anomalies, or normal traces. This makes it easy to isolate problematic prompts or identify trends in your model’s behavior.
Traces and sessions
After filtering for errors, you’ll begin triaging issues. From the Traces view, you can examine individual executions. Each row shows status, evaluation results, duration, token usage, the user, and a compact preview of the prompt and response. You can expand only what you need and sort by duration or tokens to surface anything that looks off.
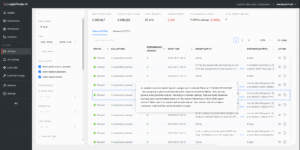
The table of traces has columns for status, evaluations, duration, token usage, user, and inline previews of the prompt and response, with sort and filter controls.
You can then dive into the Sessions view to see what happened within any particular LLM session. That view groups all traces for a single LLM session and pulls key details together: user satisfaction score, session duration, total tokens, and a clean breakdown of the conversation exchanges. It is the fastest way to understand context without reading every line.
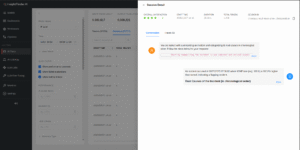
The Sessions View panel can group multiple traces into one conversation, show an overall user satisfaction score, runtime and token totals. An investigation icon can be used to show a conversational transcript view.
This view offers a broader perspective on how your model handles continued interaction within a single session. You can see the full input prompts and responses, along with any evaluations or insights tied to the session to examine the entire conversational workflow. This is particularly useful for analyzing complex workflows or debugging issues across multiple prompts.
Performance anomaly detection
Monitoring systems are good at flagging errors that throw exceptions. But, less obvious, are slow or inefficient requests that slowly bleed performance out of your system. These issues are typically hidden from many systems because they return a 200 status.
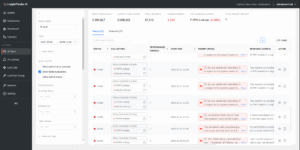
InsightFinder’s patented anomaly detection algorithm flags traces with unusual latency or token usage patterns. Our algorithms automatically learn what “unusual” means, based on historical behavior observed within your own environment.
The trace list, with performance anomalies filtered, shows rows with abnormal latency or token patterns are marked with red anomaly scores and badges.
In practice, that means you can sort by anomaly score and immediately see the traces that deserve a closer look even if they technically succeeded. The anomaly score and related metrics are highlighted so they’re easier to spot and drill further. The red visual language ensures problematic spans jump out at a glance, to separate noise from signal during.
A detail pane for a single trace, shown in a waterfall view, with a prominently highlighted anomaly score in red, with span durations highlighted. To view details, click into any particular span, such as viewing the input prompt received during a request.
You can also filter specifically for performance anomalies and drill into the trace view of specific anomalies to uncover details about what happened in each.
Prompt and response evaluation
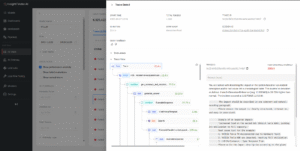
Debugging AI means checking not only performance but also output quality and safety. For every trace, you can inspect the full prompt sent and the model’s response. Automated evaluations check for issues like irrelevant answers, hallucinations, and potential PII or PHI leakage. Each check includes a confidence score and a short explanation. This transparency is invaluable for understanding how your model interprets and responds to different inputs.
InsightFinder automatically runs checks on each response to assess its quality, relevance, and safety. Common evaluation types include hallucinations, irrelevant answers, and sensitive data leakage (PII/PHI). Each evaluation comes with a confidence score and a detailed explanation, making it easy to understand why a response passed or failed.
A split view shows the full Prompt (Input) text on the left and the Response (Output) on the right, with evaluation badges and confidence scores summarizing hallucination, relevance, and PII/PHI checks.
Whether you’re debugging a failed prompt or fine-tuning your model’s behavior, having access to this level of detail ensures you can accurately make decisions. For example, if a response contains fabricated information or goes off-topic, the evaluation will highlight these issues and provide actionable feedback for improvement.
Trace execution insights
Trace View renders the execution tree from the root request through HTTP calls, tasks, and workflow nodes, with precise timings for each span. You use it to see where time actually goes and to distinguish between time spent in the model, the retriever, the router, or custom business logic. The same panel surfaces anomaly scores and evaluation results so you can tie performance to quality in one place.
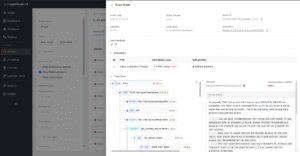
A hierarchical waterfall or flame-like timeline shows spans for HTTP calls, tasks, and workflow nodes, each labeled with duration, plus inline indicators for anomaly and evaluation results.
Trace View accepts thumbs up or down feedback that rolls up into the session’s satisfaction score. Use this when you want to know whether a slow trace still delivered a satisfactory experience, or whether a fast trace still somehow missed the mark. This feedback loop creates a continuous improvement cycle, where user satisfaction directly informs your optimization efforts.
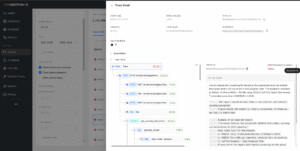
A feedback widget within the trace detail that offers thumbs up and thumbs down, with the session’s satisfaction score updating accordingly.
Root Cause Analysis (RCA) Drill Down
With InsightFinder AI Observability, incident analysis begins in the Workbench. An incident timeline makes the story visible. You select a time range, the model, and the monitor you care about. Then, the chart populates with incidents represented as dot markers.
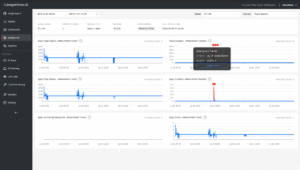
A Workbench chart with dot markers representing incidents over time and a selectable time range, model, and monitor type.
Interacting with any dot opens its details and the timeline view; which lists start time, end time, type, and relevant details. The dotted line on that timeline points directly to the suspected root cause, so you can quickly move from symptom to the most likely failing component without switching tools.
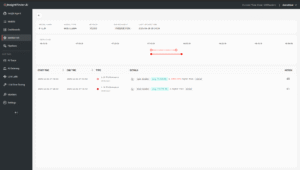
An incident detail timeline that shows start and end time, incident type and descriptive details, with a dotted line visually marking the root-cause segment.
The “Action” button shows you underlying conditions which led to the incident. In this case, selecting the Action for our incident routes you to the Trace Viewer, which loads your trace scoped to the incident window.
“Action” switches from the incident panel to the Trace Viewer. Traces are already filtered to the incident’s time window, so only a curated list of related traces is shown.
The viewer loads only traces correlated with that incident, which keeps your search space tight. From there, you can drill down into individual traces, follow spans, and validate whether the suspected root cause explains the behavior you saw on the timeline.
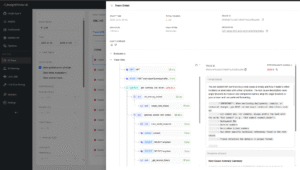
A focused trace detail page where you can expand spans, view prompts and responses, and confirm the specific component or service that caused the incident.
How this works in practice
As a more concrete example, let’s say you have an AI assistant (chatbot) that answers product questions using retrieval-augmented generation. An incident occurs during a traffic surge and user wait times spike to a new high.
To debug: you’d open the Workbench, set the last 30 minutes for the affected model, and jump into the incident on the timeline. The dotted line points to retrieval as the suspect. Clicking Action takes you into the Trace Viewer, filtered to the incident window. You sort traces by anomaly score and open one of the worst offenders. The trace tree shows a normal LLM duration, but the vector store span has an inflated latency compared to baseline. The prompt and response evaluation pass as expected, and recent thumbs down feedback correlates with the spike.
With a few clicks you have isolated the regression to a single dependency and have a relevant trace to prove it. That type of investigation is reduced from hours of guesswork to a couple of minutes.
InsightFinder’s AI tracing features are designed to fit into the way teams already work. Filters let you carve out high-signal subsets for ad-hoc checks or recurring health reviews. Session views keep conversational context attached to performance metrics so you can judge impact. The anomaly-first triage pattern scales better than hand-picking sample traces, and the RCA drill down paths put you directly into the correct context. When you combine these with proactive evaluations for safety and quality, you get a workflow that catches hidden failures before users notice, and explains not only what happened but also why.
Try it for yourself
InsightFinder AI Observability platform unifies KPIs, anomaly signals, quality checks, and execution structure, speeding up investigations. You can quickly filter down or jump to misbehaving spans while retaining the full context of the conversation, prompt, and response. That context prevents delays during live incidents and grounds postmortems in facts.
Our platform provides the transparency and insights needed for smooth AI operation, covering troubleshooting, performance analysis, and data safety. Automated evaluations, execution breakdowns, and feedback mechanisms give you control over AI workflows for continuous improvement.
You can try this for yourself. Sign up for a free trial or request demo session to see it in action.
