Welcome to InsightFinder AI Observability Docs!
Categories
Traceviewer
LLM Traces Page is a powerful and intuitive tool designed to help users understand anomalous behavior in your LLM and ML models. Powered by InsightFinder’s advanced anomaly detection engine, the LLM Traces Page automatically identifies and surfaces unusual patterns, performance issues, and problematic behaviors in AI systems and Models. Whether you’re a data scientist investigating model degradation, a developer troubleshooting unexpected AI agent responses, a DevOps engineer monitoring ML system health, or a team lead ensuring reliable AI service performance, AW LLm Traces Page gives you focused visibility to improve efficiently.
What are LLM Traces?
An LLM trace is a timeline of events that occur when a large language model processes a request or generates a response.
Every trace is made up of spans, which represent individual operations or steps within that process. For example, when a user submits a prompt, you might have spans for prompt parsing, model tokenization, retrieving context or embeddings, running the forward pass through the model, applying safety or relevance checks, and streaming the generated tokens back to the user. Each span includes details such as when it started, how long it took, and what computations or interactions occurred during that stage.
LLM traces can capture many different types of activities. Model traces show the flow of input through tokenization, inference, and generation. System traces record lower-level operations like GPU kernel executions, memory transfers, or API calls to external tools. In multi-component or agentic LLM systems, traces can follow a request across different steps such as retrieval, reasoning, tool use, and response synthesis—providing end-to-end visibility into how the model and supporting infrastructure handled the request.
Who can use Traceviewer?
AW LLM Traces page can universally be used by any role/profile and can provide a unique view and insights into application performance depending on the use case. Some examples of use cases:
- Data Scientists use AW LLM Traces to quickly identify when their LLM and ML models are behaving unexpectedly. Rather than manually sifting through thousands of normal traces, they can focus on the anomalous ones that indicate model drift, performance degradation, or data quality issues. This targeted approach helps them validate experimental results, detect when models need retraining, and understand the root causes of unexpected model outputs
- DevOps and Site Reliability Engineers use AW LLM Traces to proactively monitor AI system health by focusing on anomalous patterns rather than normal operations. The tool highlights unusual service interactions, performance spikes, and error patterns across distributed ML and LLM systems, making it easier to prevent incidents before they impact users and reduce downtime in case of incidents.
- System Administrators appreciate AW LLM Traces Page’s ability to automatically flag resource utilization anomalies and unusual performance patterns. When users report issues, administrators can immediately see if there are corresponding anomalous traces related to infrastructure problems, model inference delays, or system bottlenecks
Trace Ingestion
When creating a model in InsightFinder AW, need to have at least 1 data type as ‘Trace’ to ingest traces and perform Trace Analysis on the ingested data.
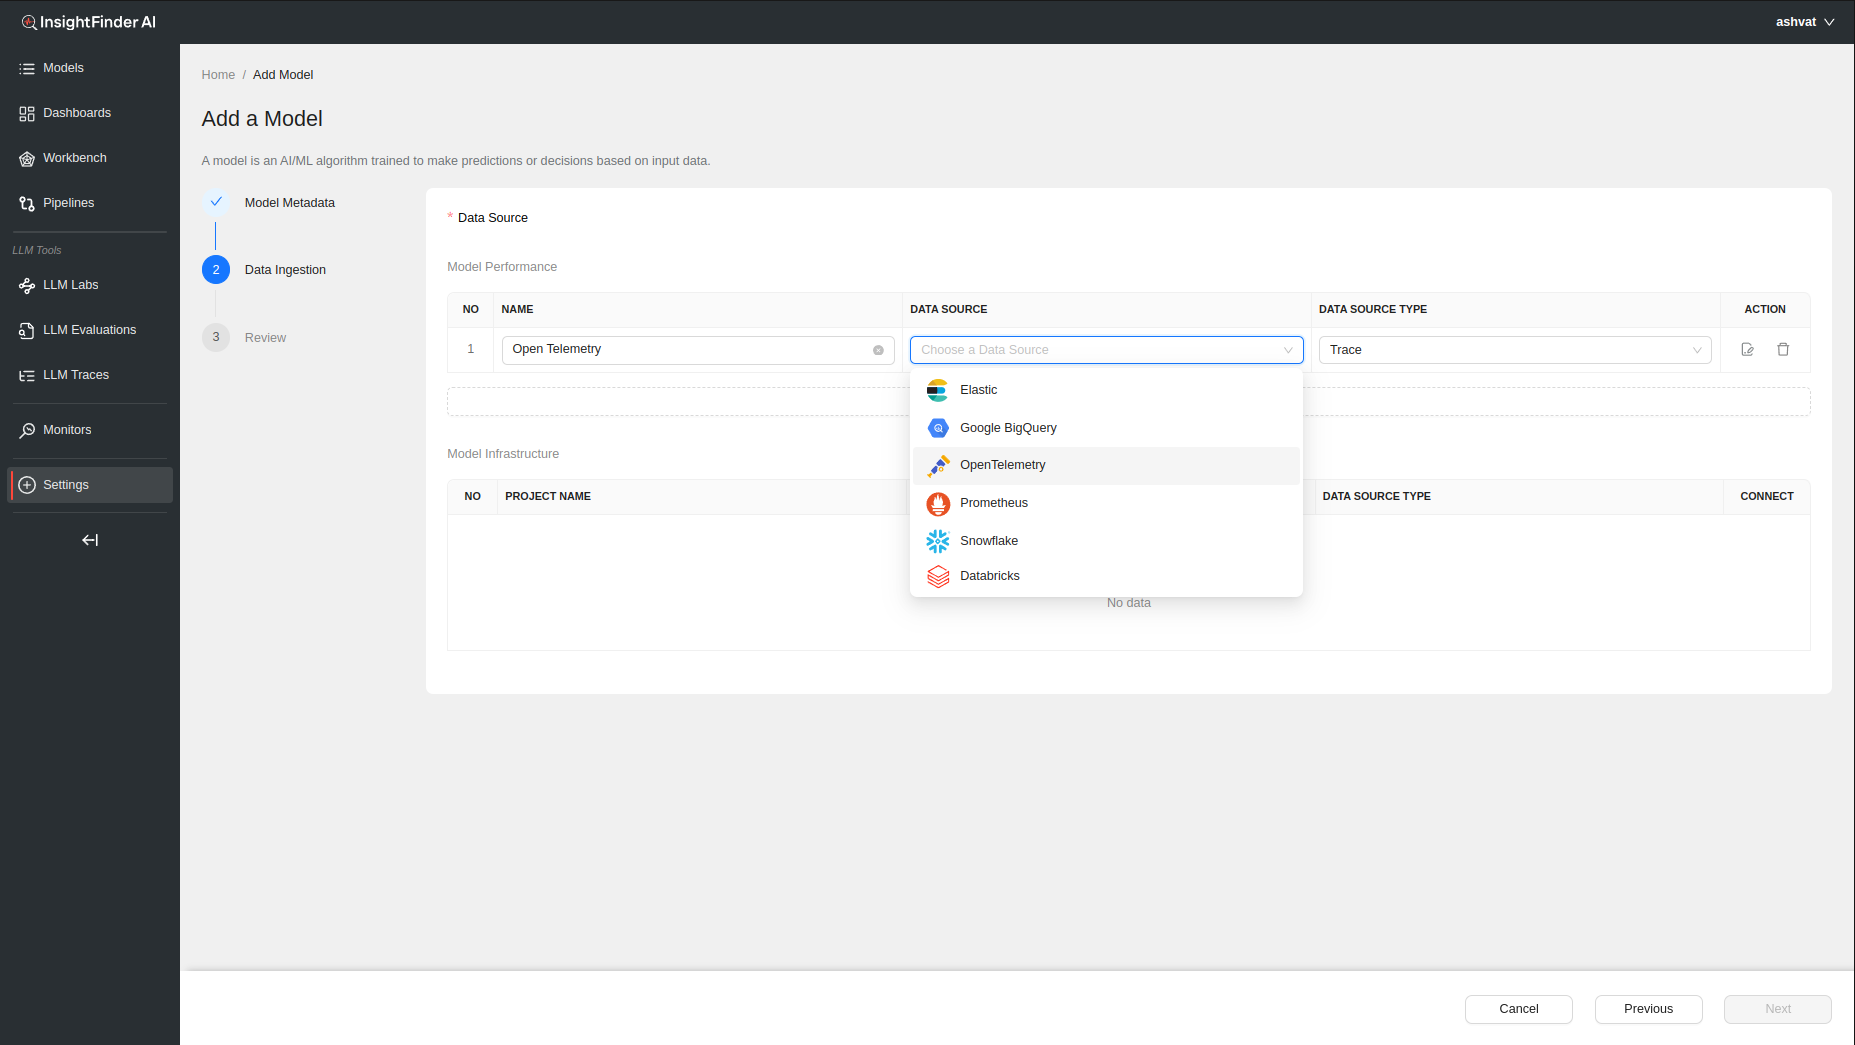
After choosing the Data Source (OpenTelemetry in this example), a pop up window will allow the users to enter all the endpoint and credentials information that will be needed to configure InsightFinder’s trace collector(s) as well as any additional configuration that might be required.
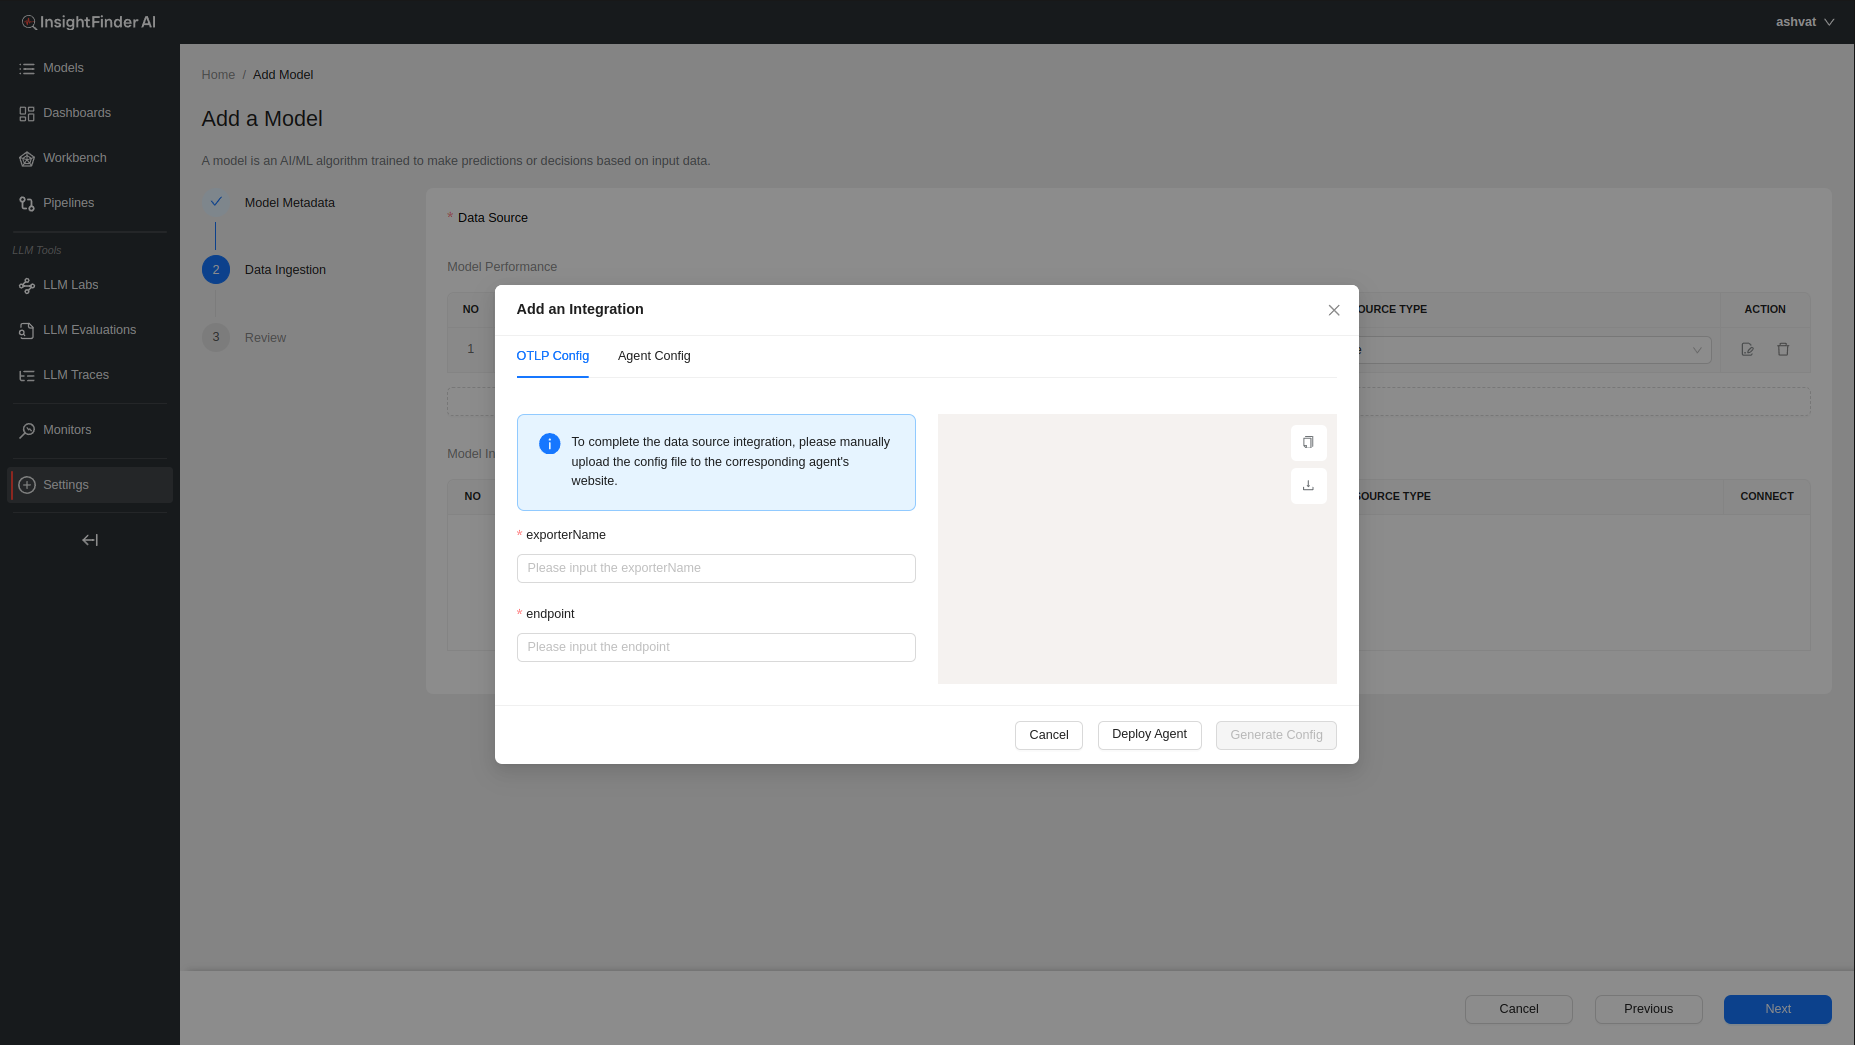
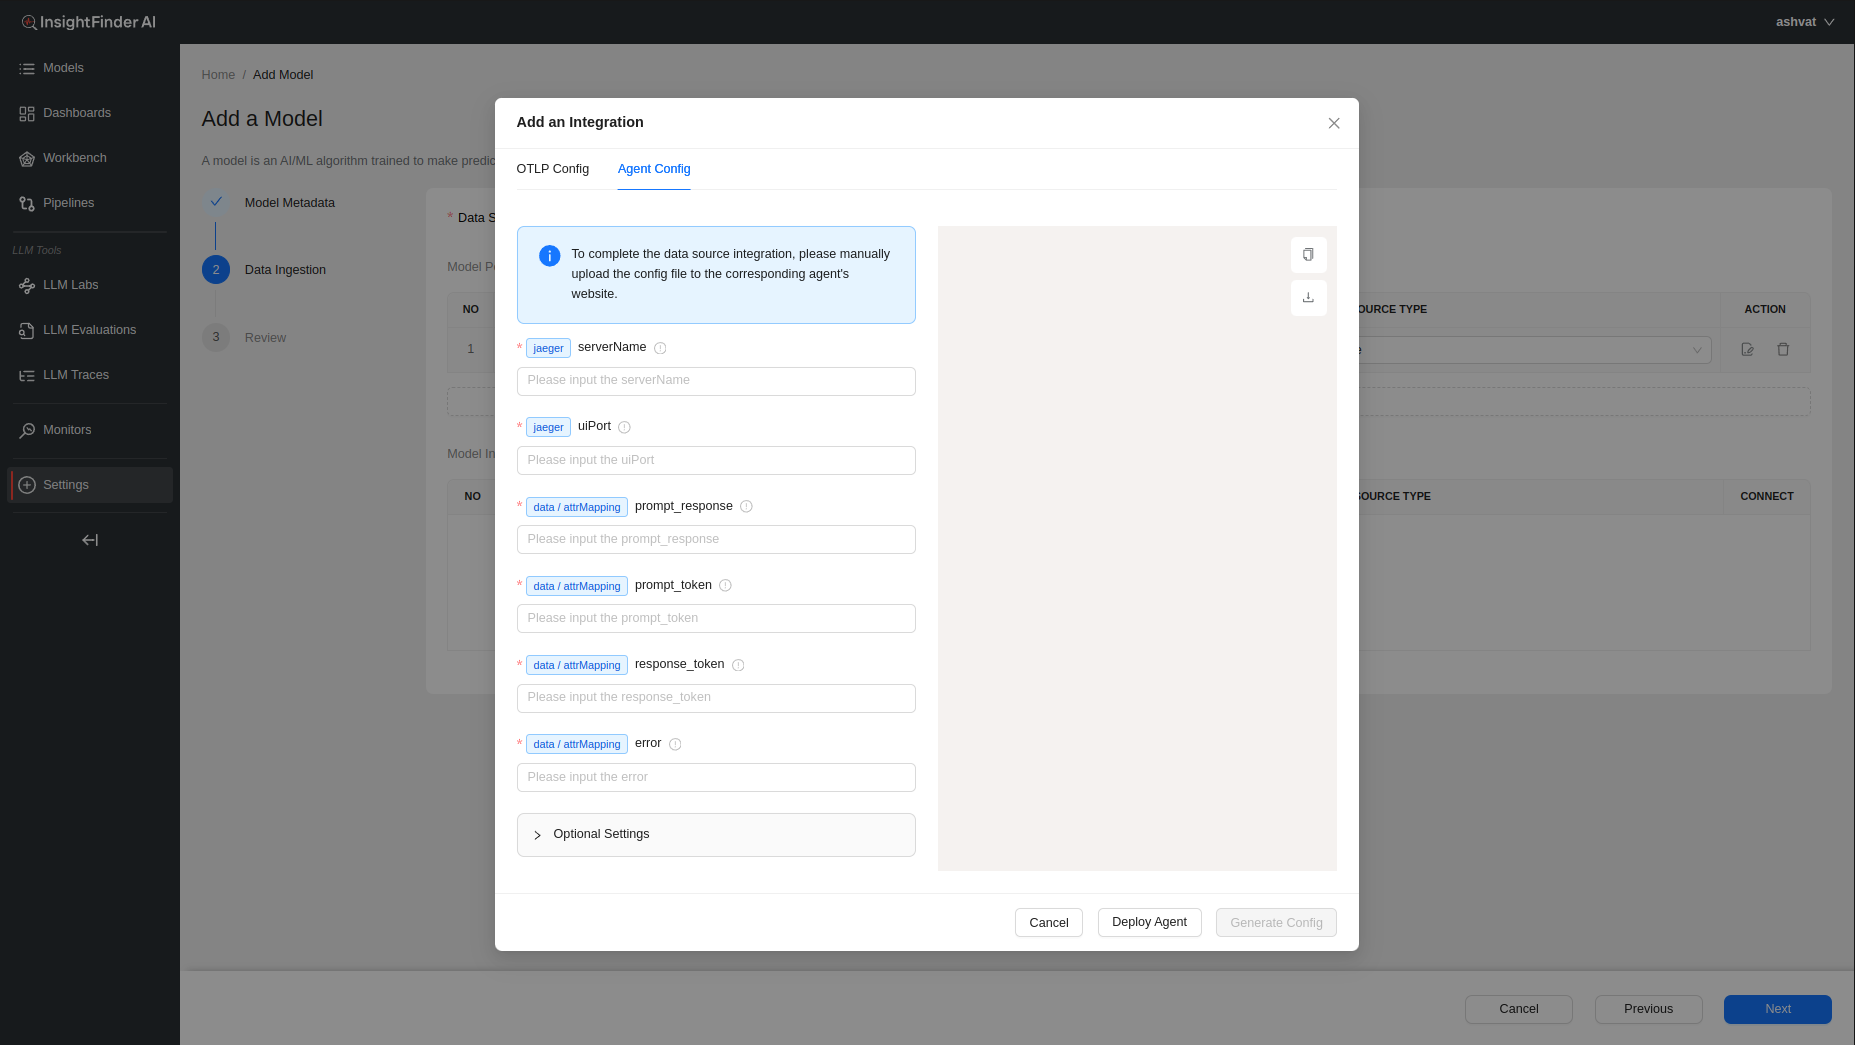
To learn more information about configuring the collector agents, users can click on the ‘Deploy Agent’ button at the bottom which will redirect the users to the ReadMe documentation for the specific data collectors.

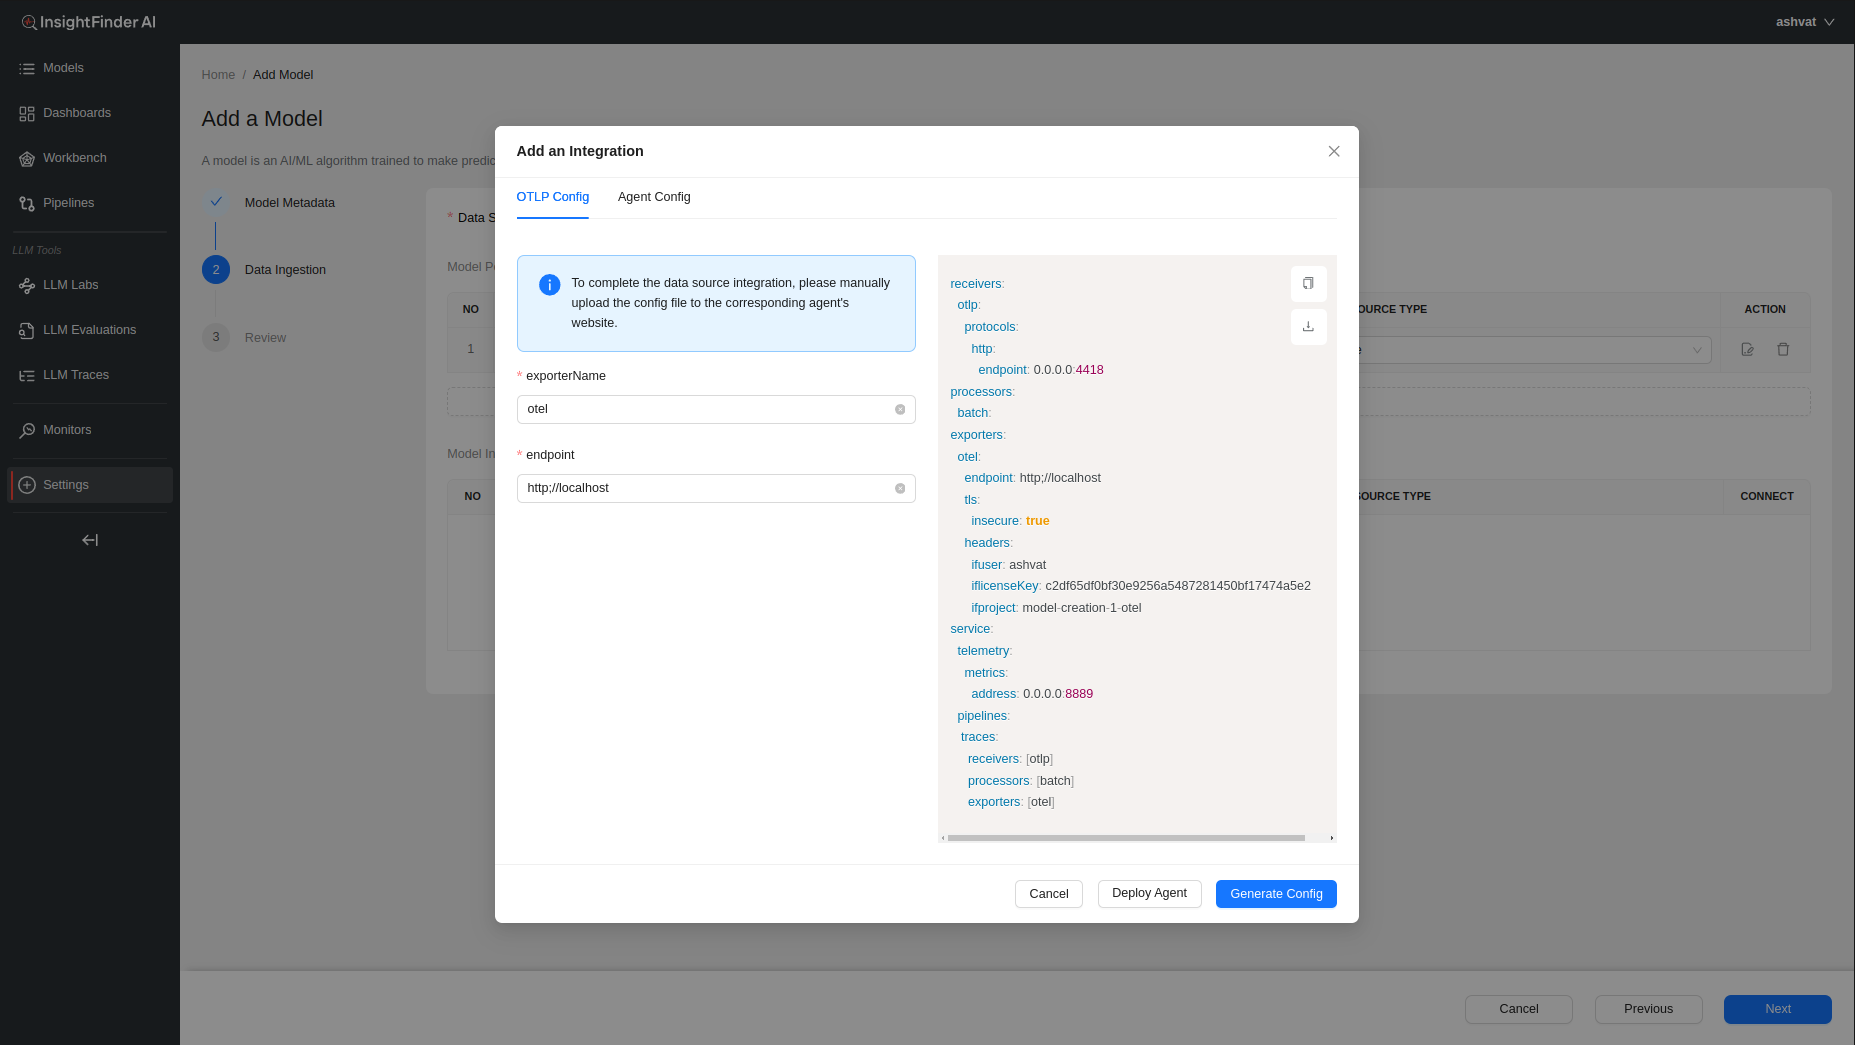
Once the required fields are filled, users can click on the ‘Generate Config’ button that becomes clickable to have InsightFinder generate the configurations required to set up streaming.
If need more information on Model Creation, please refer to the <Model-Creation-document-link>
InsightFinder Integrations with Different Tracing SDKs
Overview
This document covers 4 approaches to integrating LLM agent tracing with InsightFinder. By capturing LLM calls, responses, and metadata, it enables you to monitor and analyze LLM performance and response quality in real time.
1. Arize (via OpenInference)
- Automatic LLM instrumentation
- Child spans for each API call
- Best for: Modern Python agents, cleaner code
2. Temporal SDK
- Distributed workflow framework
- Built-in tracing interceptor
- Best for: Complex async workflows, Temporal users
3. DDTrace (Datadog)
- Lightweight auto-instrumentation
- Environment variable configuration
- Best for: Existing Datadog users, quick setup
4. Pure OpenTelemetry (OTel)
- Explicit manual span creation
- Full control, minimal magic
- Best for: Simple agents, explicit logging
Arize Tracing SDK Integration with InsightFinder
Overview
This section explains how to integrate the Arize tracing SDK into agent systems to send traces to InsightFinder for LLM prompt/response monitoring and analysis. The Arize tracing sdk SDK provides automatic instrumentation of LLM calls with OpenInference and OpenTelemetry while maintaining full compatibility with InsightFinder’s OTLP backend.
NOTE: Examples in this document use OpenAI as the LLM provider for reference, but can be extended to any LLM provider library that is supported by Arize’s openinference-instrumentation-* libraries.
Architecture
The system consists of the following components:
1. Agent Application (Your Code)
↓ OpenTelemetry spans (OpenInference-instrumented)
2. Instrumentation Layer
→ Auto-captures LLM calls, responses, and metadata
→ Adds standard LLM attributes (llm.prompt, llm.response, etc.)
↓ OTLP/gRPC
3. OTLPSpanExporter with InsightFinder Headers
→ Exports spans with InsightFinder authentication
↓ gRPC to InsightFinder Trace Server
4. InsightFinder Platform
→ Analysis & visualization of traces and LLM interactions
Prerequisites
Required Dependencies
opentelemetry-api>=1.20.0
opentelemetry-sdk>=1.20.0
opentelemetry-exporter-otlp-proto-grpc>=0.41b0
# Depending on llm provider used, import the corresponding package
openinference-instrumentation-openai
Implementation Steps
Step 1: Import Required Modules
Add these imports to your agent code:
import uuid
import openai # OpenTelemetry imports
from opentelemetry import trace
from opentelemetry.sdk.trace import TracerProvider
from opentelemetry.sdk.trace.export import BatchSpanProcessor
from opentelemetry.exporter.otlp.proto.grpc.trace_exporter import OTLPSpanExporter
from opentelemetry.sdk.resources import Resource# OpenInference instrumentation for automatic LLM tracing
from openinference.instrumentation.openai import OpenAIInstrumentor
Step 2: Configure OpenTelemetry Provider
Set up the tracer provider with InsightFinder headers and OpenInference instrumentation:
insightfinder_headers = {
“ifuser”: os.getenv(“INSIGHTFINDER_USER”),
“iflicensekey”: os.getenv(“INSIGHTFINDER_LICENSE_KEY”),
“ifproject”: os.getenv(“INSIGHTFINDER_PROJECT”),
“ifsystem”: os.getenv(“INSIGHTFINDER_SYSTEM”),
} # Configure resource with service information
resource = Resource.create({
“service.name”: “llm-agent”,
“service.version”: “1.0.0”,
})# Create OTLP exporter with InsightFinder backend
otlp_exporter = OTLPSpanExporter(
endpoint=os.getenv(“INSIGHTFINDER_ENDPOINT”, “localhost:4317”),
insecure=False, # Set to True if not using TLS
headers=insightfinder_headers, # Include InsightFinder authentication
)
# Create and configure tracer provider
tracer_provider = TracerProvider(resource=resource)
tracer_provider.add_span_processor(BatchSpanProcessor(otlp_exporter))
# Register globally
trace.set_tracer_provider(tracer_provider)
# Get the tracer
tracer = trace.get_tracer(__name__)
Step 3: Instrument LLM Client with OpenInference
Enable automatic tracing of all OpenAI API calls using OpenInference:
# This automatically captures all LLM calls (prompts, responses, tokens, etc.)
# and creates detailed child spans for each OpenAI API call
OpenAIInstrumentor().instrument(tracer_provider=tracer_provider) # Initialize OpenAI client – all calls are now automatically traced
client = openai.OpenAI(api_key=os.getenv(“OPENAI_API_KEY”))
Once instrumented, OpenInference automatically captures:
✓ LLM prompts and responses (in a dedicated `openai.chat.completions` span)
✓ Token counts (prompt, completion, total)
✓ Model name and parameters
✓ API latency and errors
✓ Request/response timing
✓ Detailed hierarchical span structure
Step 4: Create Manual Spans for Workflow Control
While OpenInference library auto-instruments LLM calls, you can create manual spans for application logic:
“””Main workflow – spans are automatically created and hierarchies maintained.””” with tracer.start_as_current_span(“your_workflow”) as span:# add session and user context to parent span
span.set_attribute(“x-session-id”, session_id)
span.set_attribute(“x-username”, user_id)
# Step 1: Gather context (contains auto-instrumented LLM call)
context = gather_context(user_query)
span.set_attribute(“step_1_complete”, True)
# Step 2: Analyze (contains auto-instrumented LLM call)
analysis = analyze_data(user_query, context)
span.set_attribute(“step_2_complete”, True)
span.set_attribute(“workflow_status”, “success”)
return {
“query”: user_query,
“context”: context,
“analysis”: analysis
}
Attributes for InsightFinder:
| Attribute | Purpose | When to Set |
| x-username (Optional) | User identifier | Before LLM call |
| x-session-id (Optional) | Session/workflow correlation ID | Before LLM call |
Step 5: Call LLM Functions (Automatically Traced)
Once OpenInference instrumentation is enabled, all LLM calls are automatically traced:
“””
Call OpenAI – OpenInference automatically captures:
– llm.prompt (input prompt in child span)
– llm.response (output response in child span)
– llm.token_count_prompt (input tokens in child span)
– llm.token_count_completion (output tokens in child span)
– llm.token_count_total (total tokens in child span)
– llm.model (model name in child span)
“”” with tracer.start_as_current_span(“ask_llm”) as span:
# Add session and user context to span
span.set_attribute(“x-session-id”, session_id)span.set_attribute(“x-username”, user_id)
# This call triggers OpenInference instrumentation
# which creates a child span “openai.chat.completions” with all LLM details
response = client.chat.completions.create(
model=model,
messages=[{“role”: “user”, “content”: prompt}],
max_tokens=150,
temperature=0.7,
)
# OpenInference instrumentation automatically adds LLM attributes to child span
# You can still add custom attributes to parent span if wanted
span.set_attribute(“request_successful”, True)
return response.choices[0].message.content.strip()
How It Works
Automatic Instrumentation Flow
1. Application Start: OpenInference instrumentation is registered with OpenAI client
2. OpenAI Call: When client.chat.completions.create() is called:
├─ OpenInference interceptor is triggered
├─ Input prompt is captured
├─ API call is executed
├─ Response and metadata are captured
└─ Child span “openai.chat.completions” is created with all LLM attributes
3. Span Hierarchy: OpenInference creates detailed parent-child structure:
your_workflow (manual span – your code)
├── gather_context (manual span – your code)
│ └── ask_llm (manual span – your code)
│ └── openai.chat.completions (AUTO CHILD SPAN by OpenInference!)
│ • llm.prompt: “Provide context about…”
│ • llm.response: “Here’s the context…”
│ • llm.token_count_prompt: 15
│ • llm.token_count_completion: 89
│ • llm.token_count_total: 104
└── analyze_data (manual span – your code)
└── ask_llm (manual span – your code)
└── openai.chat.completions (AUTO CHILD SPAN by OpenInference!)
- llm.prompt: “Analyze this…”
- llm.response: “Analysis results…”
- llm.token_count_prompt: 120
- llm.token_count_completion: 156
- llm.token_count_total: 276
4. Export: Spans (including auto-generated child spans) are batched and sent to InsightFinder via OTLP with headers
5. Processing: InsightFinder extracts LLM interactions from the detailed span hierarchy
6. Visualization: Data is analyzed and displayed in InsightFinder dashboard
Temporal SDK Tracing Integration with InsightFinder
Overview
This section explains how to integrate OpenTelemetry tracing into Temporal-based agent systems to send traces to InsightFinder for LLM prompt/response monitoring and analysis. This approach uses Temporal SDK’s built-in TracingInterceptor for automatic distributed tracing while adding custom attributes for LLM-specific data extraction.
Architecture
The system consists of the following components:
1. Temporal Agent (Your Code)
↓ OpenTelemetry spans with custom attributes
2. TracingInterceptor (Temporal SDK)
→ Provides automatic Temporal tracing
↓ OTLP/gRPC
3. Trace Server (InsightFinder)
→ Extracts prompt/response pairs and formats data for InsightFinder
↓ HTTP API
4. InsightFinder Platform
→ Analysis & visualization
Prerequisites
Required Dependencies
Install the following Python packages:
opentelemetry-api
opentelemetry-sdk
opentelemetry-exporter-otlp-proto-grpc
Implementation Steps
Step 1: Import Required Modules
Add these imports to your Temporal agent code:
import uuid # OpenTelemetry imports
from opentelemetry import trace
from opentelemetry.sdk.trace import TracerProvider
from opentelemetry.sdk.trace.export import BatchSpanProcessor
from opentelemetry.exporter.otlp.proto.grpc.trace_exporter import OTLPSpanExporter
from opentelemetry.sdk.resources import Resource# Temporal OpenTelemetry integration
from temporalio.contrib.opentelemetry import TracingInterceptor
# Temporal SDK
from temporalio.client import Client
from temporalio import activity, workflow
Step 2: Configure OpenTelemetry Provider
Create a function to set up the OpenTelemetry tracer with InsightFinder headers:
“””Configure OpenTelemetry with OTLP exporter for InsightFinder trace server.””” # Create resource with service information
resource = Resource.create({
“service.name”: “agent-service-name”,
“service.version”: “1.0.0”,
})# Read configuration from environment
endpoint = os.getenv(“OTEL_EXPORTER_OTLP_ENDPOINT”, “https://localhost:4317”)
# InsightFinder authentication headers (sent as gRPC metadata)
headers = {
“ifuser”: “<INSIGHTFINDER_USER>”,
“iflicensekey”: “<INSIGHTFINDER_LICENSE_KEY>”,
“ifproject”: “<INSIGHTFINDER_PROJECT_NAME>”,
“ifsystem”: “<INSIGHTFINDER_SYSTEM_NAME>”,
}
# Create OTLP exporter
otlp_exporter = OTLPSpanExporter(
endpoint=endpoint,
headers=headers,
insecure=False # Set to False if using TLS
)
# Set up tracer provider with batch span processor
provider = TracerProvider(resource=resource)
processor = BatchSpanProcessor(otlp_exporter)
provider.add_span_processor(processor)
# Set as global tracer provider
trace.set_tracer_provider(provider)
return trace.get_tracer(__name__)
Key Configuration Points:
- Resource: Identifies your service in traces
- Headers: InsightFinder authentication (passed as gRPC metadata)
- Endpoint: Your trace server URL (OTLP over gRPC)
- BatchSpanProcessor: Batches spans for efficient export
Step 3: Initialize Temporal Client with TracingInterceptor
In your main function, connect the Temporal client with the tracing interceptor:
# Set up OpenTelemetry
tracer = setup_opentelemetry() # Connect to Temporal with tracing interceptor
client = await Client.connect(
os.getenv(“TEMPORAL_ADDRESS”, “localhost:7233”),
interceptors=[TracingInterceptor(tracer)] # ← Enable automatic tracing
)# Start your workflow
result = await client.execute_workflow(
YourWorkflow.run,
“your-input”,
id=f”workflow-{uuid.uuid4()}”,
task_queue=”your-task-queue”,
)
return result
if __name__ == “__main__”:
import asyncio
asyncio.run(main())
Step 4: Add Custom Attributes to Activities
For any activity that makes LLM calls, add custom attributes to the current span:
async def your_llm_activity(task: str) -> str:
“””Example activity that calls an LLM.””” # Get the current span created by TracingInterceptor
current_span = trace.get_current_span()# Prepare the LLM prompt (This is a placeholder, prompt should contain actual prompt to LLM)
user_prompt = f”Your prompt text here: {task}”
# Add attributes BEFORE making the LLM call
if current_span:
# The input prompt sent to the LLM
current_span.set_attribute(“chat.prompt”, user_prompt)
# User and session identification (Optional)
current_span.set_attribute(“x-username”,”workflow-user”)
workflow_id = activity.info().workflow_id
current_span.set_attribute(“x-session-id”,)
try:
# Make your LLM call (example with OpenAI)
response = await your_llm_client.chat.completions.create(
model=”gpt-4o”,
messages=[{“role”: “user”, “content”: user_prompt}]
)
llm_response = response.choices[0].message.content
# Add response and token usage AFTER receiving the response
if current_span:
current_span.set_attribute(“chat.response”, llm_response)
current_span.set_attribute(“chat.model”, response.model)
# Token usage (if available)
if response.usage:
current_span.set_attribute(“chat.prompt_tokens”, response.usage.prompt_tokens)
current_span.set_attribute(“chat.completion_tokens”, response.usage.completion_tokens)
current_span.set_attribute(“chat.total_tokens”, response.usage.total_tokens)
return llm_response
except Exception as e:
# Add error information to span
if current_span:
current_span.set_attribute(“error”, str(e))
raise
Required Attributes for InsightFinder:
| Attribute | Purpose | When to Set |
| chat.prompt | Input prompt sent to LLM | Before LLM call |
| chat.response | LLM’s response | After LLM call |
| x-username (Optional) | User identifier | Before LLM call |
| x-session-id (Optional) | Session/workflow correlation ID | Before LLM call |
| chat.prompt_tokens | Token usage (input) | After LLM call |
| chat.completion_tokens | Token usage (output) | After LLM call |
| chat.total_tokens | Total token usage | After LLM call |
| chat.model | Model used | After LLM call |
| error | Error message (if any) | On exception |
How It Works
─
Trace Flow
1. Client Start: When you execute a workflow, TracingInterceptor creates a root span
2. Workflow Execution: A child span is created for the workflow execution
3. Activity Execution: A child span is created for each activity
- Automatic: Temporal metadata (workflow_id, activity_type, etc.)
- Manual: Your custom LLM attributes (prompt, response, tokens)
4. Export: Spans are batched and sent to trace server via OTLP/gRPC
5. Processing: InsightFinder extracts prompt/response pairs based on span attributes
6. Storage: Data is sent to InsightFinder for analysis
Span Hierarchy Example
workflow-execution (span.kind=server)
└── StartWorkflow:YourMainWorkflow
└── StartChildWorkflow:YourSubWorkflow
└── RunActivity:your_llm_activity (span.kind=server) ← Your custom attributes here
- chat.prompt: “Analyze this task…”
- chat.response: “Based on analysis…”
- chat.prompt_tokens: 45
- chat.completion_tokens: 120
Why TracingInterceptor is Important
The TracingInterceptor provides:
✓ Automatic span creation for workflows and activities
✓ Trace context propagation across Temporal boundaries
✓ Parent-child relationships maintaining execution hierarchy
✓ Standard OpenTelemetry attributes (span.kind, service.name, etc.)
✓ Temporal-specific attributes (workflow_id, run_id, activity_type)
Without it, you would need to manually:
- Create spans for each operation
- Pass trace context as workflow/activity parameters
- Manage parent-child span relationships
- Set all standard attributes yourself
DataDog Trace SDK Integration with InsightFinder
Overview
This guide explains how to integrate Datadog’s ddtrace library into your agent systems to send distributed traces to InsightFinder for LLM prompt/response monitoring and analysis. This approach uses ddtrace’s automatic instrumentation combined with custom span tags for LLM-specific data extraction.
NOTE: Examples in this document use OpenAI as the LLM provider for reference, but can be extended to any LLM provider library that is supported by ddtrace instrumentation.
Architecture
The system consists of the following components:
1. Agent Code (Your Python Application)
↓ LLM client calls (auto-instrumented by ddtrace)
↓ Custom span tags (prompt, response, tokens)
2. DDTrace (Python Instrumentation Library)
→ Auto-instruments OpenAI library
→ Captures LLM interactions
↓ GRPC to InsightFinder Trace Collector
3. InsightFinder Trace Collector
→ Receives traces from ddtrace
→ Forwards to InsightFinder
↓ HTTP/gRPC API
4. InsightFinder Platform
→ Processes trace data
→ Extracts prompt/response pairs
→ Analysis & visualization
Prerequisites
──
Required Dependencies
Install the following Python packages:
DDTrace Configuration
Method 1: Environment Variables (Recommended)
export DD_TRACE_ENABLED=true
export DD_SERVICE=”<agent-service-name>”
export DD_ENV=”production”# Trace backend – set to InsightFinder’s trace endpoint
export DD_AGENT_HOST=”<InsightFinder-Trace-Endpoint>”
export DD_TRACE_AGENT_PORT=”<InsightFinder-Trace-Port>”
Method 2: In-Code Configuration
service=”<agent-service-name>”,
hostname=”<InsightFinder-Trace-Endpoint>”,
port=<InsightFinder-Trace-Port>,
https=True/False,
)
Implementation Steps
──
Step 1: Import Required Modules
Add these imports to your agent code:
from ddtrace import tracer, patch
Key Components
- ddtrace.tracer: Core tracing object for creating and managing spans
- ddtrace.patch(): Enables automatic instrumentation of libraries
- os: For accessing environment variables
Step 2: Enable Automatic Library Instrumentation
Enable the auto instrumentation of the library using ddtrace patch.
patch(openai=True)# Initialize OpenAI client
OPENAI_API_KEY = os.getenv(“OPENAI_API_KEY”)
client = openai.OpenAI(api_key=OPENAI_API_KEY)
Step 3: Create LLM Call Function with Custom Tags
Using the ddtrace tracer, wrap LLM calls in a traced function with custom span tags for InsightFinder:
# Create a custom span for the function
with tracer.trace(“ask_openai”, service=”llm-agent”) as span: # Tag the span metadata and prompt for InsightFinderspan.set_tag(“span.kind”, “internal”)
span.set_tag(“chat.prompt”, prompt)
span.set_tag(“x-username”,”agent-user”)
span.set_tag(“”x-session-id”, session_id)
# Make the LLM call
response = client.chat.completions.create(
model=model,
messages=[{“role”: “user”, “content”: prompt}],
max_tokens=150,
temperature=0.7,
)
answer = response.choices[0].message.content.strip()
# Tag the response content for InsightFinder
span.set_tag(“chat.response”, answer)
# Add token usage metadata
span.set_tag(“chat.completion_tokens”, response.usage.completion_tokens)
span.set_tag(“chat.prompt_tokens”, response.usage.prompt_tokens)
span.set_tag(“chat.total_tokens”, response.usage.total_tokens)
# Add model information
span.set_tag(“chat.model”, model)
return answer
Required Attributes for InsightFinder:
| Attribute | Purpose | When to Set |
| span.kind | Identifies Type of span for processing | Before LLM Call |
| chat.prompt | Input prompt sent to LLM | Before LLM call |
| chat.response | LLM’s response | After LLM call |
| x-username (Optional) | User identifier | Before LLM call |
| x-session-id (Optional) | Session/workflow correlation ID | Before LLM call |
| chat.prompt_tokens | Token usage (input) | After LLM call |
| chat.completion_tokens | Token usage (output) | After LLM call |
| chat.total_tokens | Total token usage | After LLM call |
| chat.model | Model used | After LLM call |
Step 4: Set Attributes for Parent Spans
For multi-step agent workflows, add the required attributes along with any other wanted:
“””
Parent span containing multi-step agent reasoning and LLM calls
“””
with tracer.trace(“agentic_workflow”, service=”llm-agent”) as parent_span: parent_span.set_tag(“span.kind”, “internal”)parent_span.set_tag(“x-username”,”agent-user”)
parent_span.set_tag(“”x-session-id”, session_id)
…
# Step 1: Reasoning (internal step, no LLM call)
with tracer.trace(“agent_reasoning_step”, service=”llm-agent”) as span:
…
# Step 2: Context gathering (LLM call 1)
with tracer.trace(“agent_gather_context”, service=”llm-agent”) as span:
…
# Step 3: Synthesis (LLM call 2)
with tracer.trace(“agent_synthesize_insight”, service=”llm-agent”) as span:
…
Required Attributes for InsightFinder:
| Attribute | Purpose | When to Set |
| span.kind | Identifies Type of span for processing | Before LLM call |
| x-username | User identifier | Before LLM call |
| x-session-id | Session/workflow correlation ID | Before LLM call |
| chat.model | Model used | After LLM call |
Step 5: Add Error Handling
Tag errors into spans if wanting to record and analyze the errors:
with tracer.trace(“ask_openai”, service=”llm-agent”) as span: …try:
…
return answer
except Exception as e:
# Tag error information
span.set_tag(“error”, str(e))
span.set_tag(“error.type”, type(e).__name__)
raise
Required Attributes for InsightFinder:
| Attribute | Purpose | When to Set |
| error | Capture error during LLM call | After LLM call |
How It Works
Trace Flow
1. Initialization: Your code imports ddtrace and patches OpenAI
2. Environment Setup: DDTrace reads `DD_AGENT_HOST`, `DD_TRACE_AGENT_PORT`, etc. from environment
3. Span Creation: `tracer.trace()` creates spans
4. Auto–Instrumentation**: DDTrace automatically captures all OpenAI API calls (via the patch)
5. Tag Addition: You explicitly set custom tags like `chat.prompt` and `chat.response`
6. Span Export: Spans are batched and sent to trace collector
7. Collection: Trace collector receives and processes the traces
8. Forwarding: Trace collector forwards to InsightFinder
9. Processing: InsightFinder extracts prompt/response pairs and processes them
Span Hierarchy Example
agentic_workflow (parent span)
├── agent_reasoning_step (internal, no LLM)
│ └── tags: step, query, agent.reasoning
├── agent_gather_context (LLM call 1)
│ └── ask_openai (child span)
│ ├── chat.completions.create (auto-instrumented by patch)
│ └── tags: chat.prompt, chat.response, chat.prompt_tokens, etc.
└── agent_synthesize_insight (LLM call 2)
└── ask_openai (child span)
├── chat.completions.create (auto-instrumented by patch)
└── tags: chat.prompt, chat.response, chat.prompt_tokens, etc.
OpenTelemetry SDK Tracing Integration with InsightFinder
Overview
This guide explains how to integrate OpenTelemetry tracing into agent systems to send traces to InsightFinder for LLM prompt/response monitoring and analysis. This approach uses OpenTelemetry SDK’s manual span instrumentation for complete control over distributed tracing while adding custom attributes for LLM-specific data extraction.
Architecture
The system consists of the following components:
1. Agent Application (Your Code)
↓ OpenTelemetry spans with custom attributes
2. TracerProvider (OpenTelemetry SDK)
→ Manages tracer and span processors
↓ OTLP/gRPC
3. OTLPSpanExporter (OpenTelemetry)
→ Exports spans with InsightFinder headers
↓ gRPC to InsightFinder Trace Server
4. InsightFinder Platform
→ Analysis & visualization of traces and LLM interactions
Prerequisites
Required Dependencies
Install the following Python packages:
opentelemetry-api>=1.20.0opentelemetry-sdk>=1.20.0
opentelemetry-exporter-otlp-proto-grpc>=0.41b0
Implementation Steps
──
Step 1: Import Required Modules
Add these imports to your Temporal agent code:
import uuid # OpenTelemetry imports
from opentelemetry import trace
from opentelemetry.sdk.trace import TracerProvider
from opentelemetry.sdk.trace.export import BatchSpanProcessor
from opentelemetry.exporter.otlp.proto.grpc.trace_exporter import OTLPSpanExporter
from opentelemetry.sdk.resources import Resource
Step 2: Configure OpenTelemetry Provider
Create a function to set up the OpenTelemetry tracer with InsightFinder headers:
“””Configure OpenTelemetry with OTLP exporter for InsightFinder trace server.””” # Create resource with service information
resource = Resource.create({
“service.name”: “agent-service”,
“service.version”: “1.0.0”,
})# Read configuration from environment
endpoint = os.getenv(“OTEL_EXPORTER_OTLP_ENDPOINT”, “localhost:4317”)
# InsightFinder authentication headers (sent as gRPC metadata)
headers = {
“ifuser”: os.getenv(“INSIGHTFINDER_USER”),
“iflicensekey”: os.getenv(“INSIGHTFINDER_LICENSE_KEY”),
“ifproject”: os.getenv(“INSIGHTFINDER_PROJECT_NAME”),
“ifsystem”: os.getenv(“INSIGHTFINDER_SYSTEM_NAME”),
}
# Create OTLP exporter
otlp_exporter = OTLPSpanExporter(
endpoint=endpoint,
headers=headers,
insecure=True/False # Set to True for non-TLS endpoints
)
# Set up tracer provider with batch span processor
provider = TracerProvider(resource=resource)
processor = BatchSpanProcessor(otlp_exporter)
provider.add_span_processor(processor)
# Set as global tracer provider
trace.set_tracer_provider(provider)
return trace.get_tracer(__name__)
Key Configuration Points:
- Resource: Identifies your service in traces
- Headers: InsightFinder authentication (passed as gRPC metadata)
- Endpoint: Your trace server URL (OTLP over gRPC)
- BatchSpanProcessor: Batches spans for efficient export
Configuration via Environment Variables
You can override configuration using environment variables:
export OTEL_EXPORTER_OTLP_ENDPOINT=trace.insightfinder.com:4317 # InsightFinder credentials
export INSIGHTFINDER_USER=your_user
export INSIGHTFINDER_LICENSE_KEY=your_license_key
export INSIGHTFINDER_PROJECT_NAME=your_project
export INSIGHTFINDER_SYSTEM_NAME=your_system# Service identification
export OTEL_SERVICE_NAME=agent-service
export OTEL_SERVICE_VERSION=1.0.0
Step 3: Initialize Tracer in Your Application
Initialize the tracer at application startup:
Step 4: Create Spans for Your Workflow
Use context managers to create and manage spans. Example:
“””Main workflow that coordinates agent tasks.””” # Create a parent span for the entire workflow
with tracer.start_as_current_span(“your_workflow”) as span:span.set_attribute(“x-username”, agent-user)
span.set_attribute(“x-session-id”, session_id)
# Each function has its own tracer creating spans as needed, shown in step 5
# Step 1: Reasoning
reasoning = agent_reasoning_step(user_query)
span.set_attribute(“step_1_reasoning”, “complete”)
# Step 2: Context gathering with LLM call
context = agent_gather_context(user_query)
span.set_attribute(“step_2_context_gathered”, “complete”)
# Step 3: Insight synthesis with LLM call
insight = agent_synthesize_insight(user_query, context)
span.set_attribute(“step_3_insight_synthesized”, “complete”)
# Final summary
span.set_attribute(“workflow_status”, “success”)
span.set_attribute(“total_llm_calls”, 2)
return {
“query”: user_query,
“reasoning”: reasoning,
“context”: context,
“insight”: insight
}
Step 5: Add Custom Attributes to Activities
For any activity that makes LLM calls, add custom attributes to the current span:
“””Call LLM and track the interaction in traces.””” # Create a span for this LLM operation
with tracer.start_as_current_span(“ask_llm”) as span:
span.set_attribute(“x-username”, agent-user)
span.set_attribute(“x-session-id”, session_id)# Add the input prompt BEFORE making the LLM call
span.set_attribute(“chat.prompt”, prompt)
try:
# Make your LLM call (example with OpenAI)
response = client.chat.completions.create(
model=model,
messages=[{“role”: “user”, “content”: prompt}],
max_tokens=150,
temperature=0.7,
)
llm_response = response.choices[0].message.content.strip()
# Add response and metadata AFTER receiving the response
span.set_attribute(“chat.response”, llm_response)
span.set_attribute(“chat.model”, model)
# Token usage information
if response.usage:
span.set_attribute(“chat.prompt_tokens”, response.usage.prompt_tokens)
span.set_attribute(“chat.completion_tokens”, response.usage.completion_tokens)
span.set_attribute(“chat.total_tokens”, response.usage.total_tokens)
return llm_response
except Exception as e:
# Add error information to span
span.set_attribute(“error”, str(e))
span.set_attribute(“error.type”, type(e).__name__)
raise
Required Attributes for InsightFinder:
| Attribute | Purpose | When to Set |
| chat.prompt | Input prompt sent to LLM | Before LLM call |
| chat.response | LLM’s response | After LLM call |
| x-username (Optional) | User identifier | Before LLM call |
| x-session-id (Optional) | Session/workflow correlation ID | Before LLM call |
| chat.prompt_tokens | Token usage (input) | After LLM call |
| chat.completion_tokens | Token usage (output) | After LLM call |
| chat.total_tokens | Total token usage | After LLM call |
| chat.model | Model used | After LLM call |
| error | Error message (if any) | On exception |
How It Works
─
Trace Flow
1. Application Start: TracerProvider is initialized with OTLP exporter and InsightFinder headers
2. Workflow Execution: A root span is created for the entire workflow
3. Sub-operations: Child spans are created for each operation (reasoning, context gathering, etc.)
- Automatic: Standard OpenTelemetry attributes (span.kind, service.name, etc.)
- Manual: Your custom LLM attributes (prompt, response, tokens)
4. Export: Spans are batched and sent to trace server via OTLP/gRPC with InsightFinder metadata headers
5. Processing: InsightFinder extracts prompt/response pairs based on span attributes
6. Storage: Data is sent to InsightFinder for analysis and visualization
Span Hierarchy Example
your_workflow (root span)
├── agent_reasoning_step (child span)
│ └── [reasoning logic]
├── agent_gather_context (child span)
│ └── ask_llm (child span) ← LLM interaction
│ • chat.prompt: “Provide key facts about: quantum computing”
│ • chat.response: “Quantum computing uses quantum mechanics…”
│ • chat.prompt_tokens: 15
│ • chat.completion_tokens: 89
│ • chat.total_tokens: 104
└── agent_synthesize_insight (child span)
└── ask_llm (child span) ← LLM interaction
- chat.prompt: “Given this context… What are implications?”
- chat.response: “Key implications include…”
- chat.prompt_tokens: 120
- chat.completion_tokens: 156
- chat.total_tokens: 276
Context Propagation
OpenTelemetry automatically maintains context across span creation:
with tracer.start_as_current_span(“parent”) as parent_span:
parent_span.set_attribute(“operation”, “workflow”) # This child span automatically has parent context
with tracer.start_as_current_span(“child”) as child_span:
child_span.set_attribute(“operation”, “task”)
# child_span is automatically linked as a child of parent_span
Iftracer-sdk
The iftracer-sdk is InsightFinder’s Python SDK built on top of OpenTelemetry that empowers developers to monitor and debug Large Language Model (LLM) executions with minimal intrusion. It enables distributed tracing of prompt calls, LLM responses, vector database interactions, and more—while integrating smoothly with your existing observability stack (e.g., Datadog, Honeycomb, etc.)
Setup and Quick Start
- Install the SDK (via PyPI):
- Initialize in your code, typically at entry point (e.g., __init__.py):
from iftracer.sdk import IftracerIftracer.init(
api_endpoint=”https://otlp.insightfinder.com”,
iftracer_user=”YOUR_USER”,
iftracer_license_key=”YOUR_LICENSE_KEY”,
iftracer_project=”YOUR_TRACE_PROJECT”,
)
- Instrument functions using decorators to capture tracing spans automatically:
from iftracer.sdk.decorators import workflow, task@workflow(name=”my_workflow”)
def my_workflow(…):
…
@task(name=”my_task”)
def my_task(…):
…
- Choosing Between Iftracer Decorators
- Use @aworkflow, @atask over an asynchronous function. Use @workflow, @task over a synchronous function.
- Use @aworkflow or @workflow when the function calls multiple tasks or workflows and combines their results, when the function is a high-level orchestration of a process, when you need to get more tags, or when you intend to create a logical boundary for a workflow execution. Otherwise, use @atask or @task.
Once configured, each decorated function generates trace data—including LLM model names, embedding model details, and RAG datasets as tags—allowing for full-stack observability and real-time analytics via the InsightFinder platform
InsightFinder LLM Labs Trace Projects
When using InsightFinder LLM Labs, a dedicated trace project/model is automatically created and populated with your LLM traces. This eliminates the need for manual project setup—every LLM request, response, and intermediate step is automatically ingested into the trace model.
The resulting project in InsightFinder provides:
- End-to-end visibility of prompt execution and downstream dependencies.
- Automatic correlation of LLM spans with context such as datasets, model type, and evaluation results.
- Real-time monitoring of performance, failures, and safety issues.
This means developers can start analyzing and troubleshooting LLM workflows immediately, without extra configuration.
InsightFinder Trace Analysis
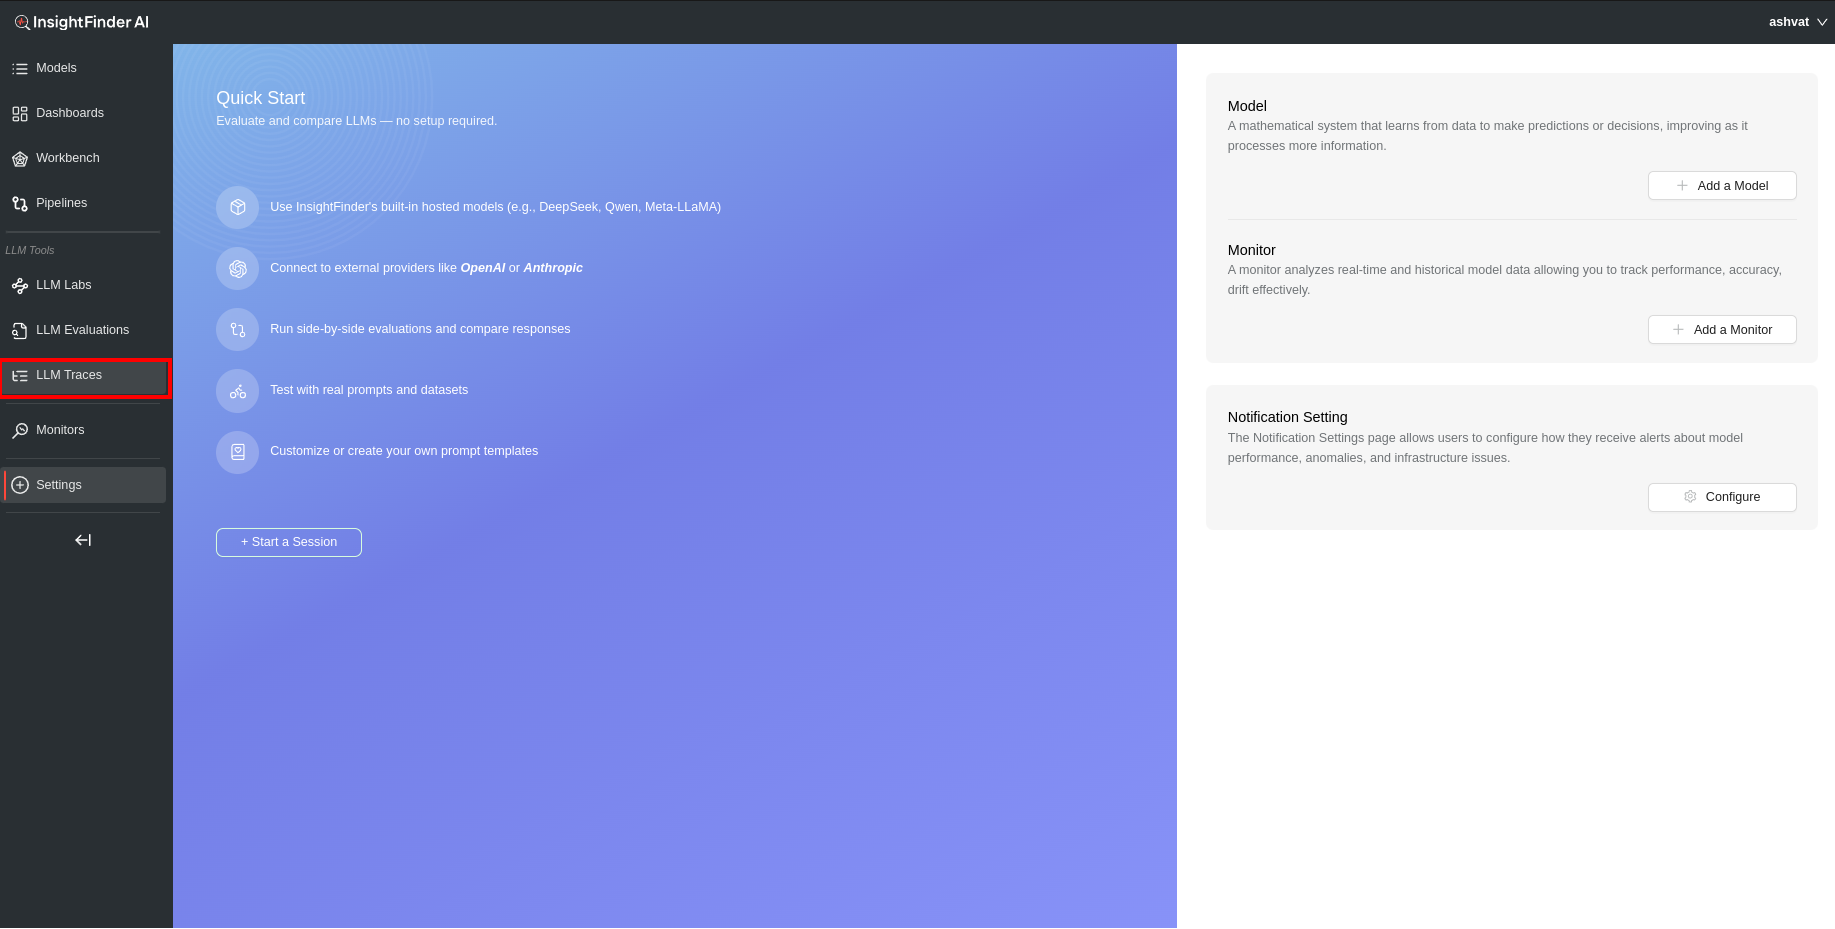
LLM Traces Page
From anywhere on the InsightFinder AW UI, click on the LLM Traces on the side navigation bar to go to the AW LLM Traces Page.
Once on the AW LLM Traces Page, Select the model from the drop down (or can type it in to narrow the search).
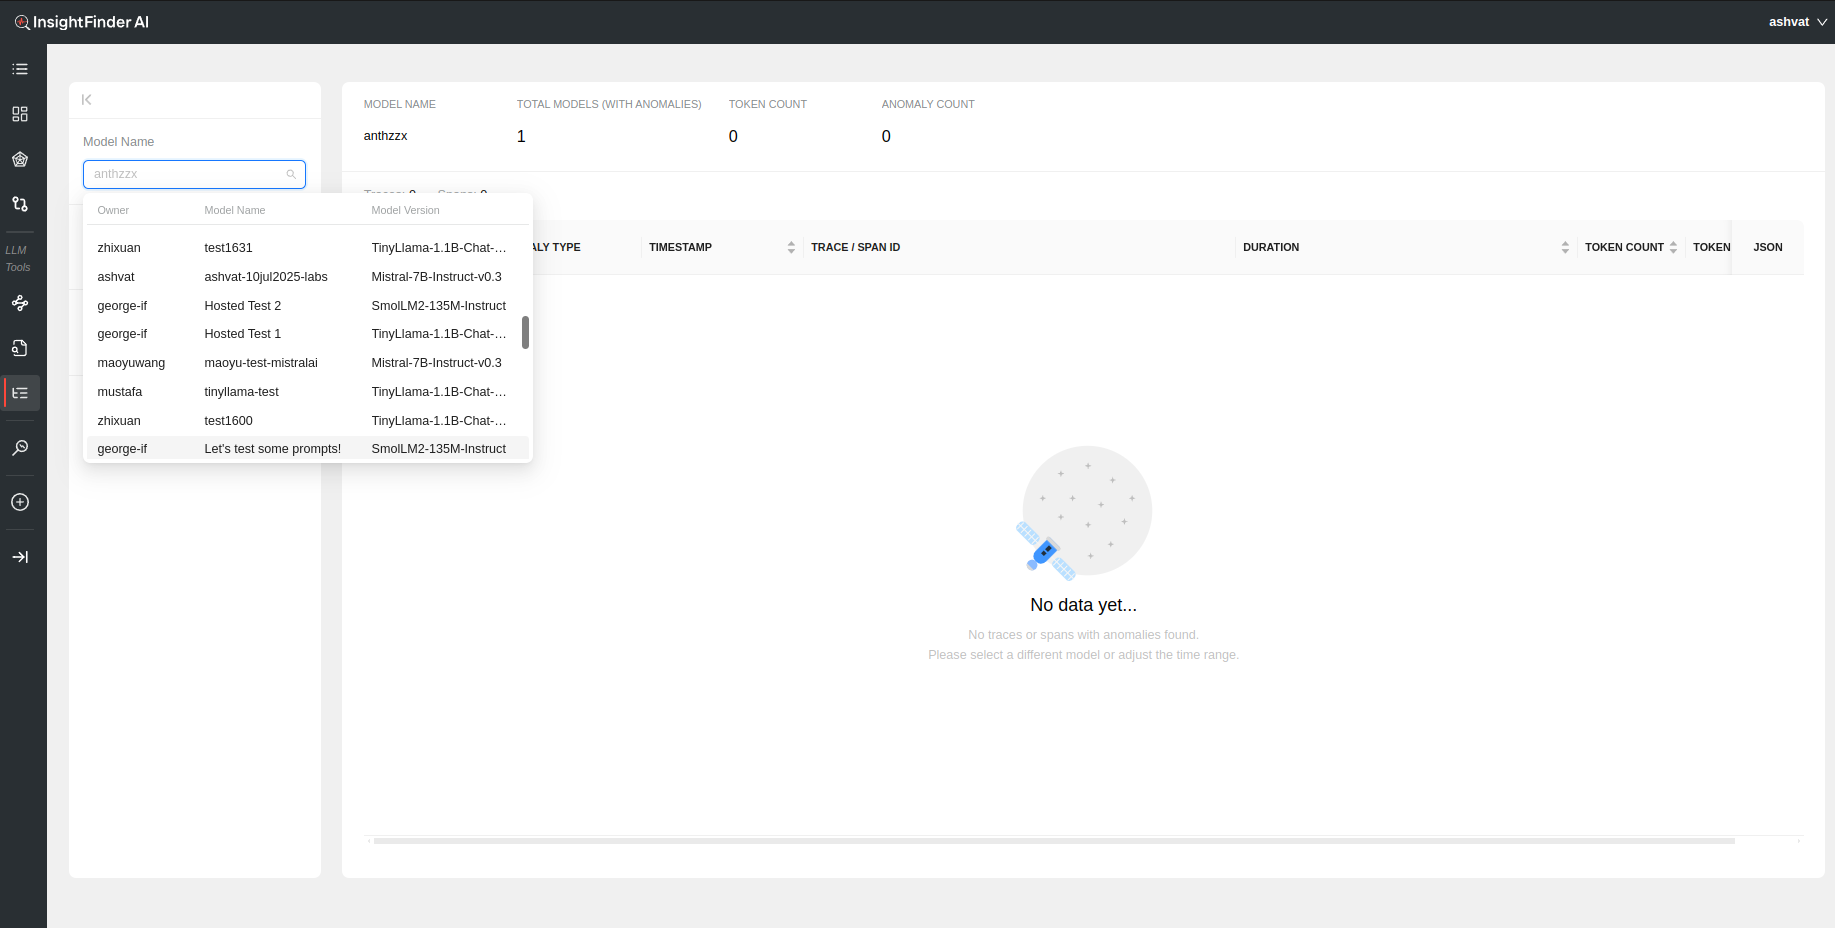
Once the model is selected, all the trace data that was detected as anomalous by InsightFinder WatchTower will be displayed for that model’s traffic.
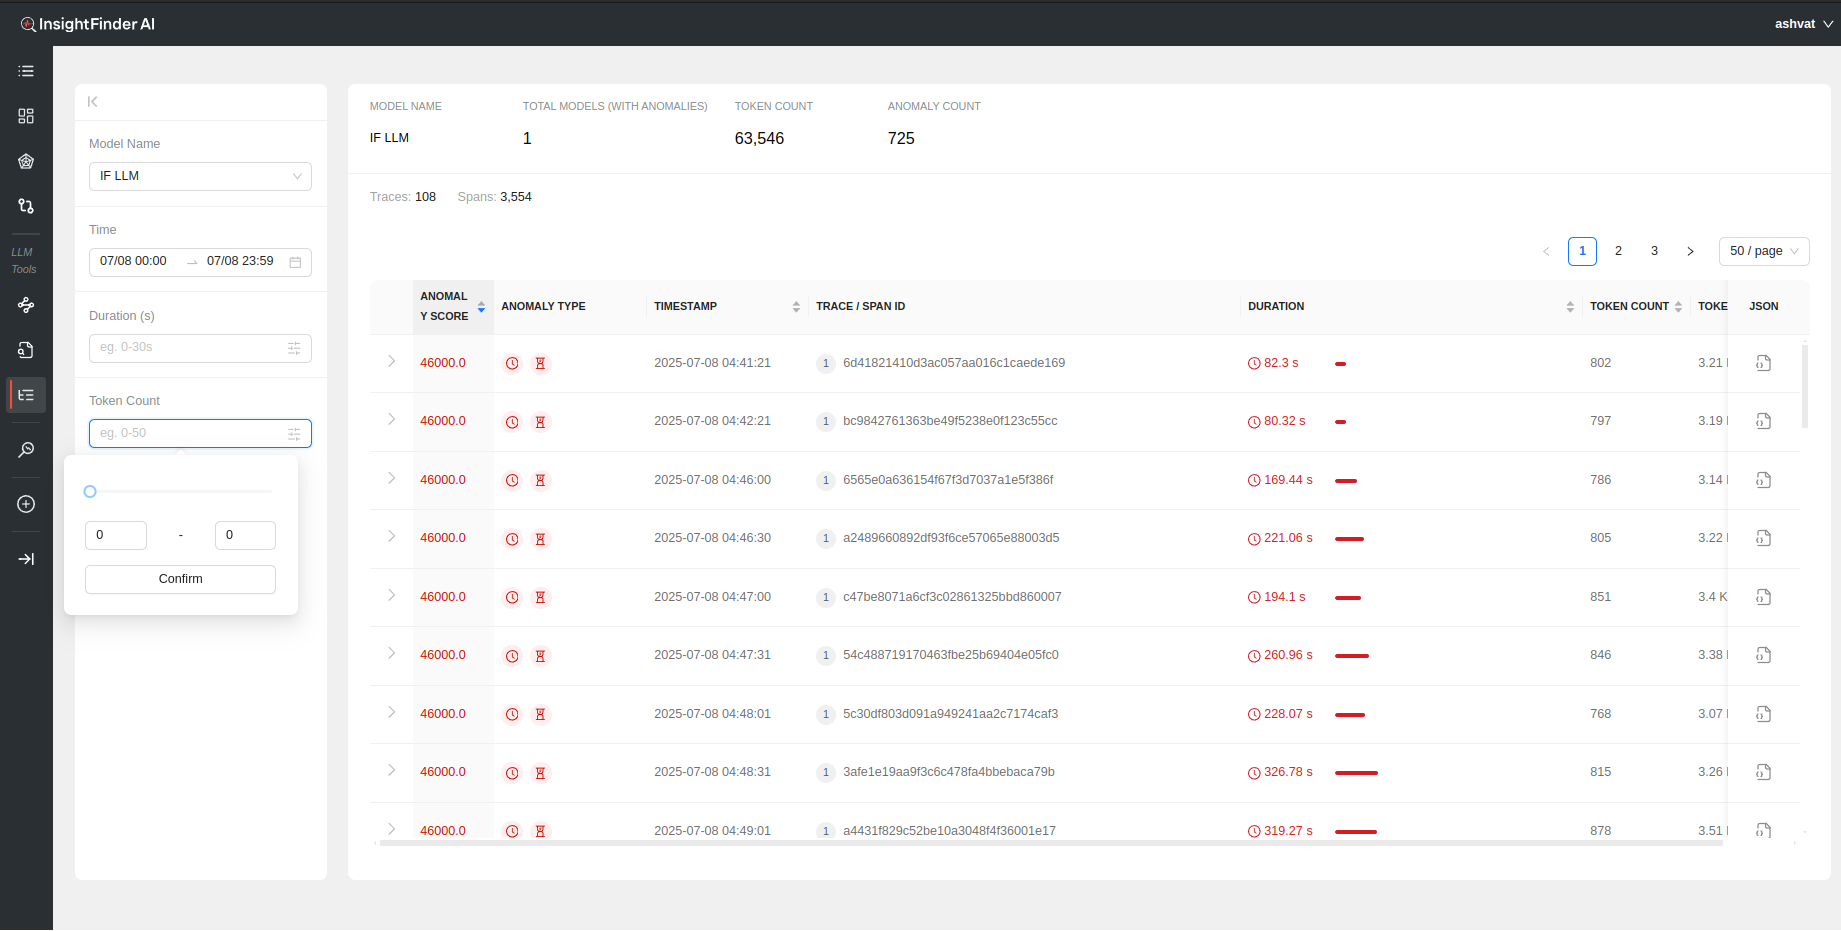
Filtering
By default all the anomalous traces for the past 24 hours are loaded and displayed. The search can be further filtered based on the following selections:
- Time: Time and Date range for which to load the data. Can manually update the time by editing the time for start and end dates.
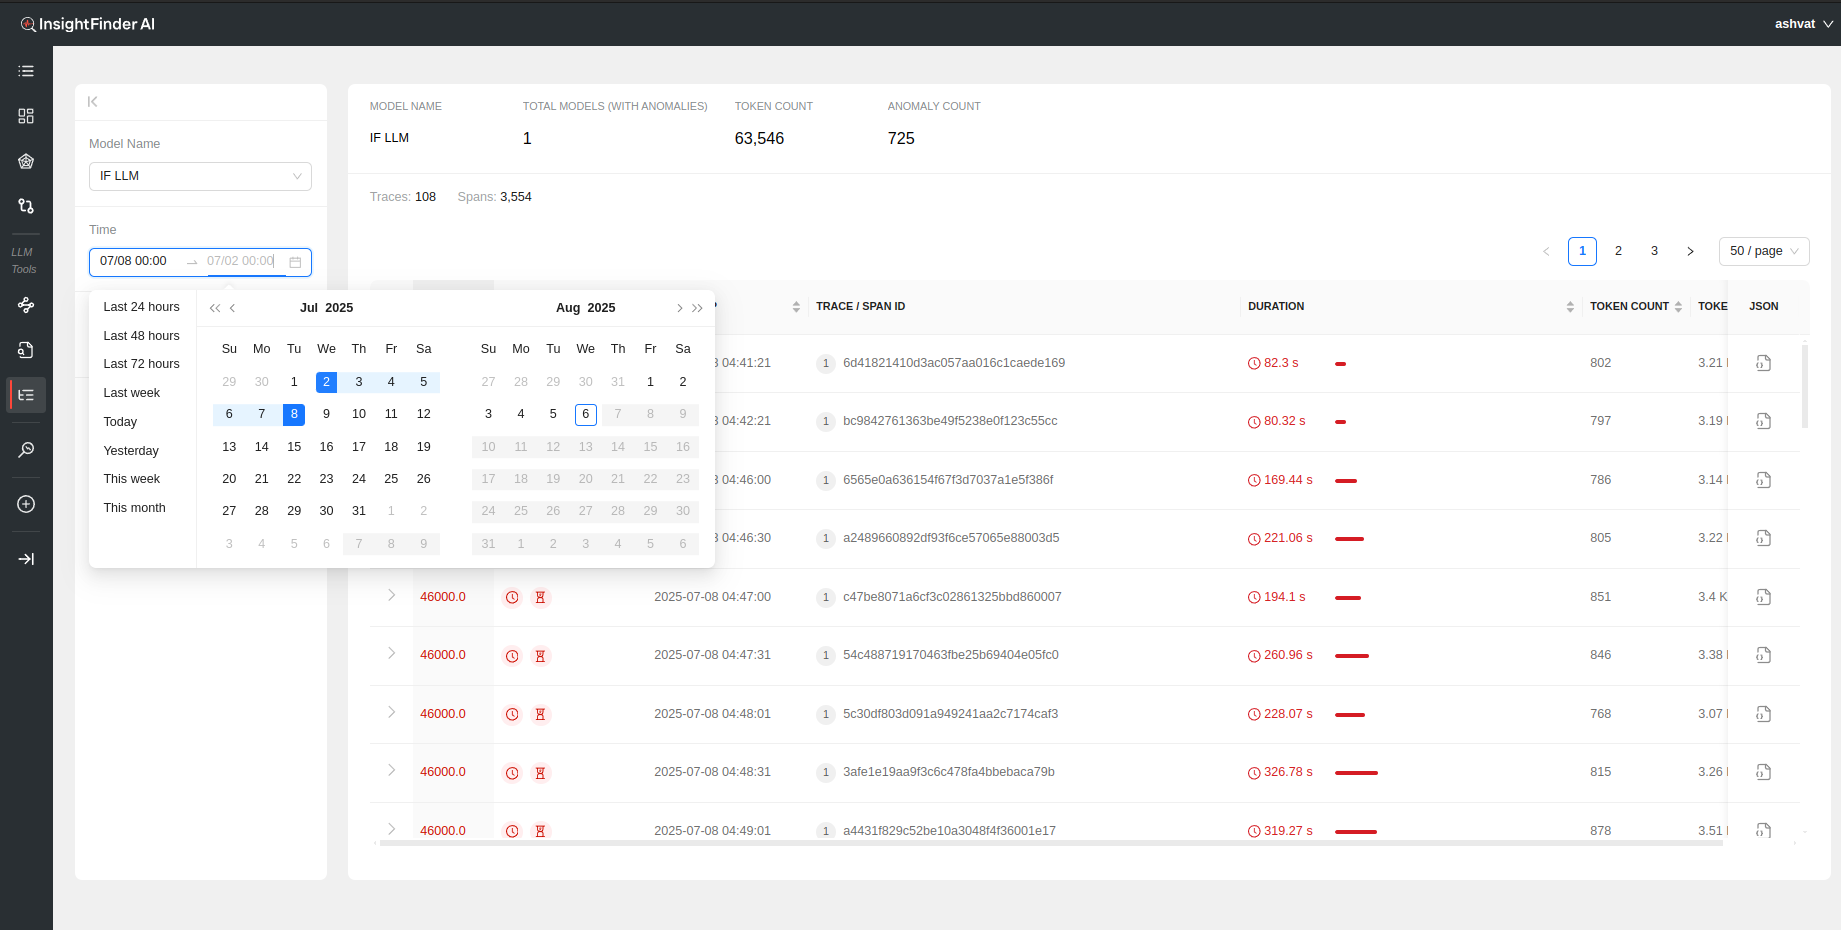
- Duration(s): Filter based on the time duration of the traces
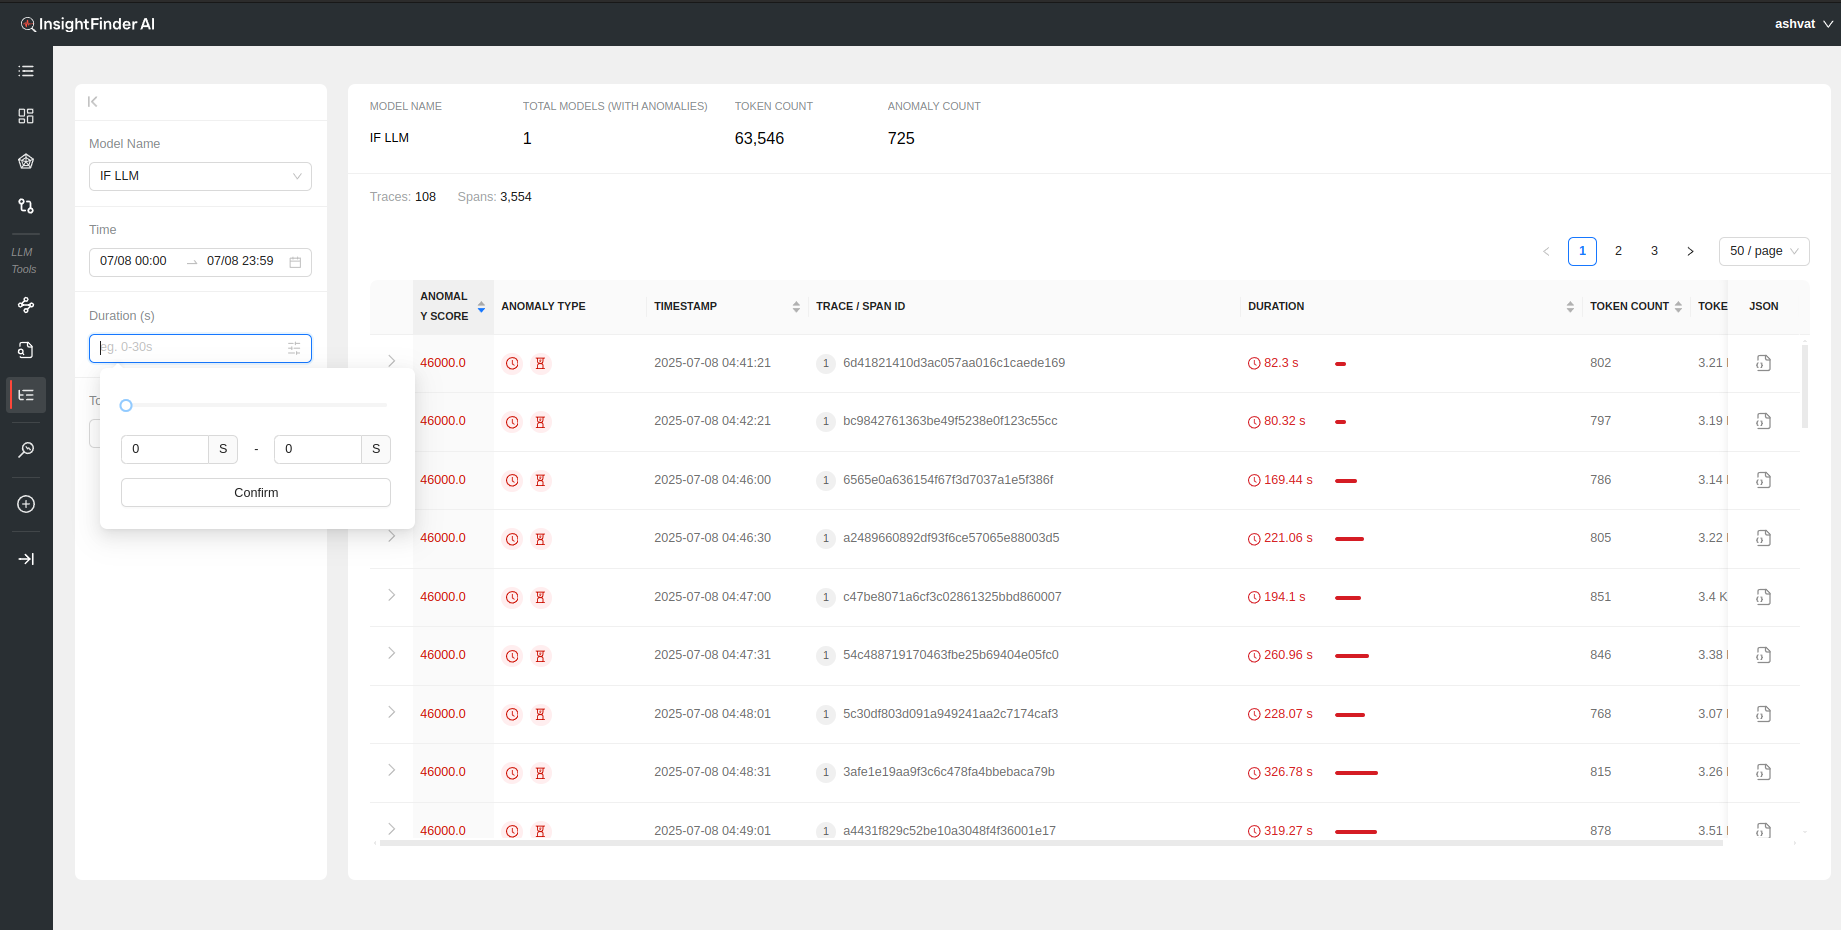
- Token Count: Filter based on minimum and maximum token count per trace
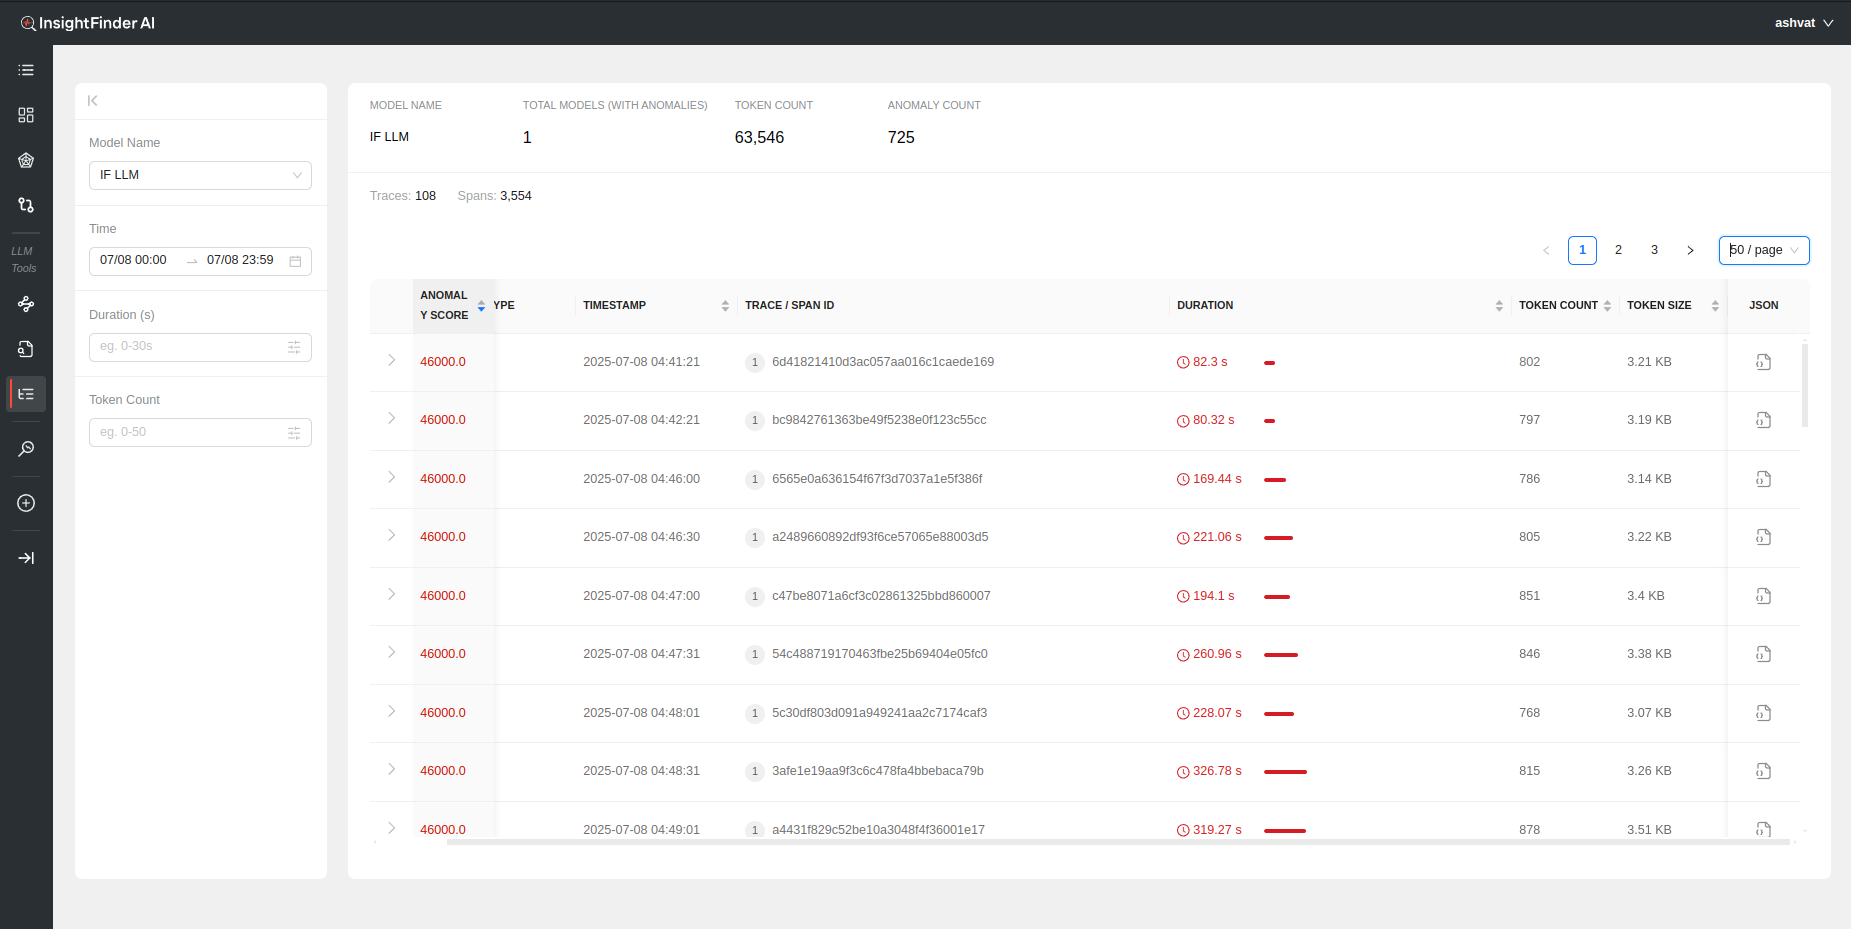
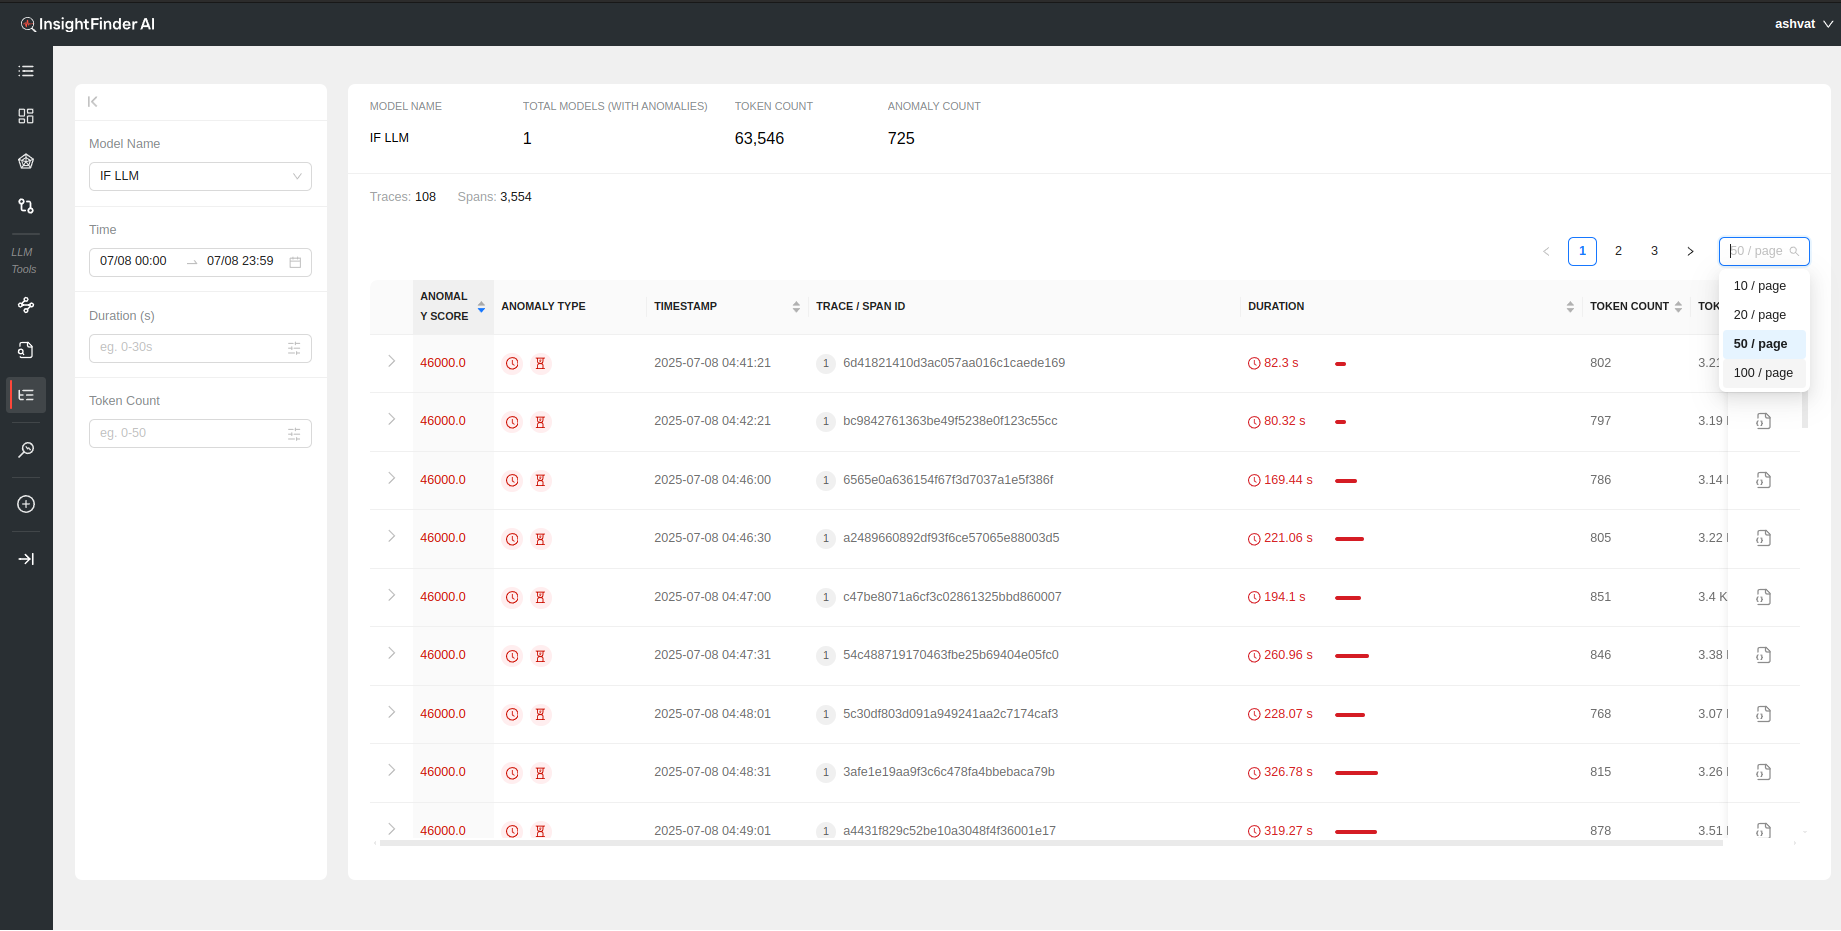
Analyzing the Data
Once the data is loaded, a holistic view of the total token count, total anomaly count, total traces and spans can be seen on top of the page.
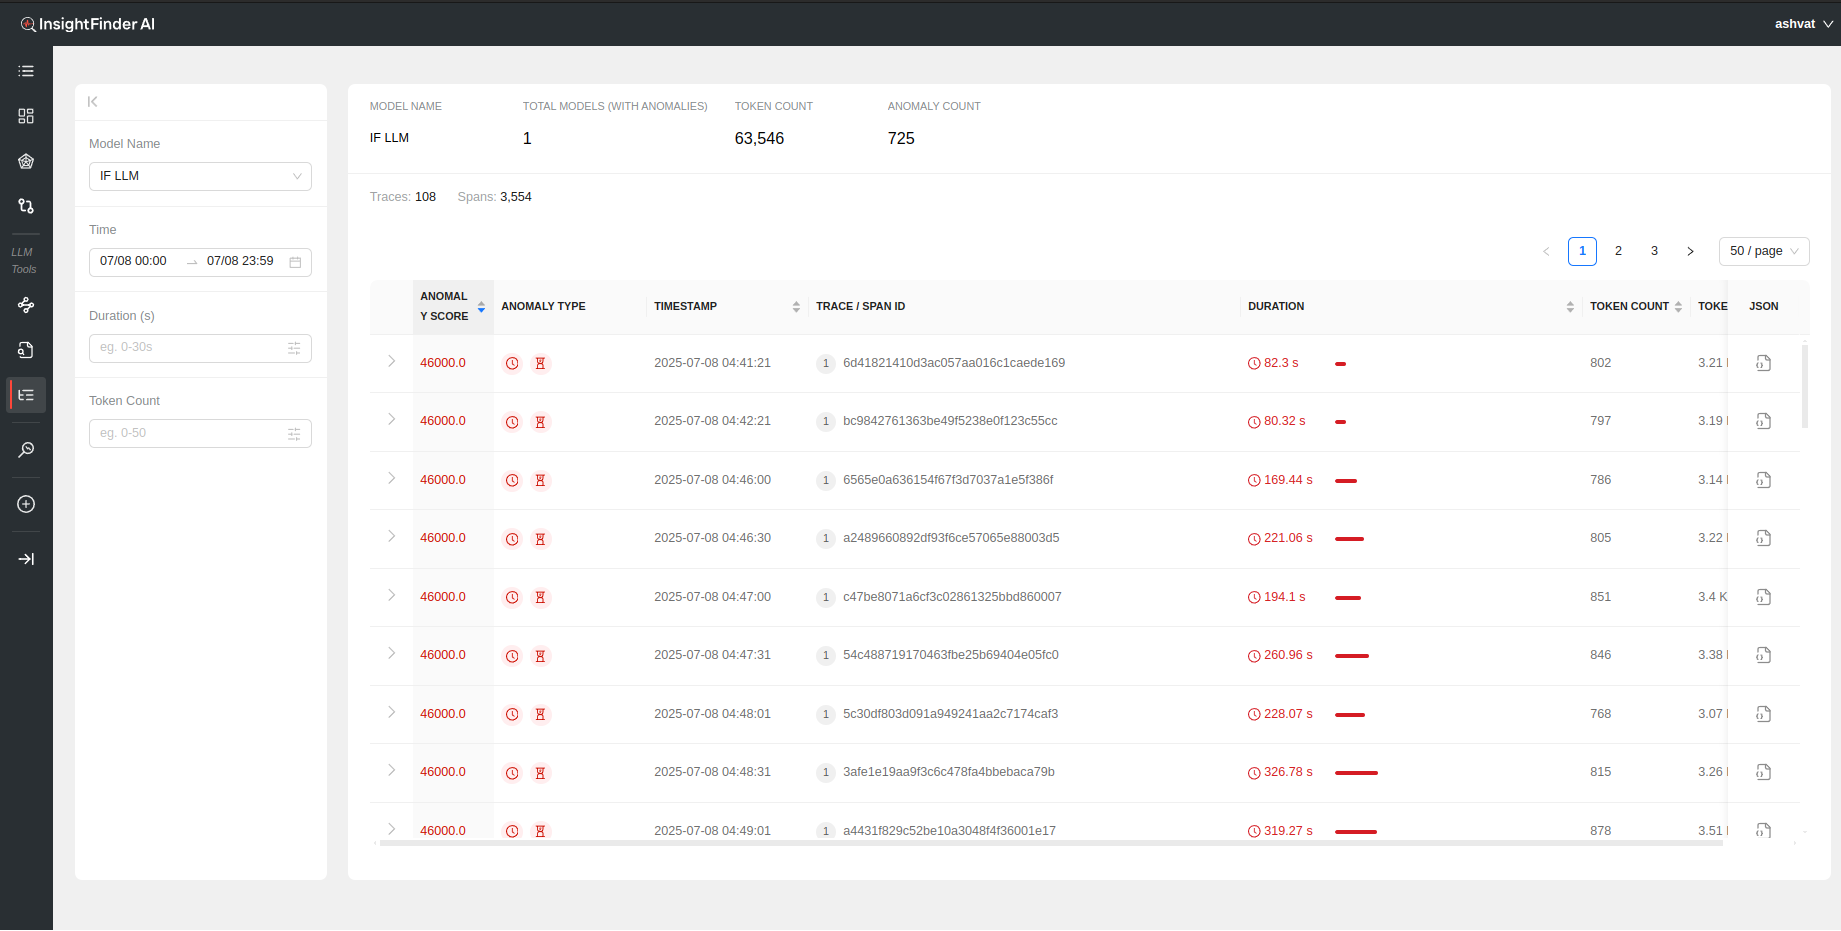
Each anomalous trace can also be further analyzed by looking at the individual spans within the trace by clicking on the > to show the respective Spans for the Trace
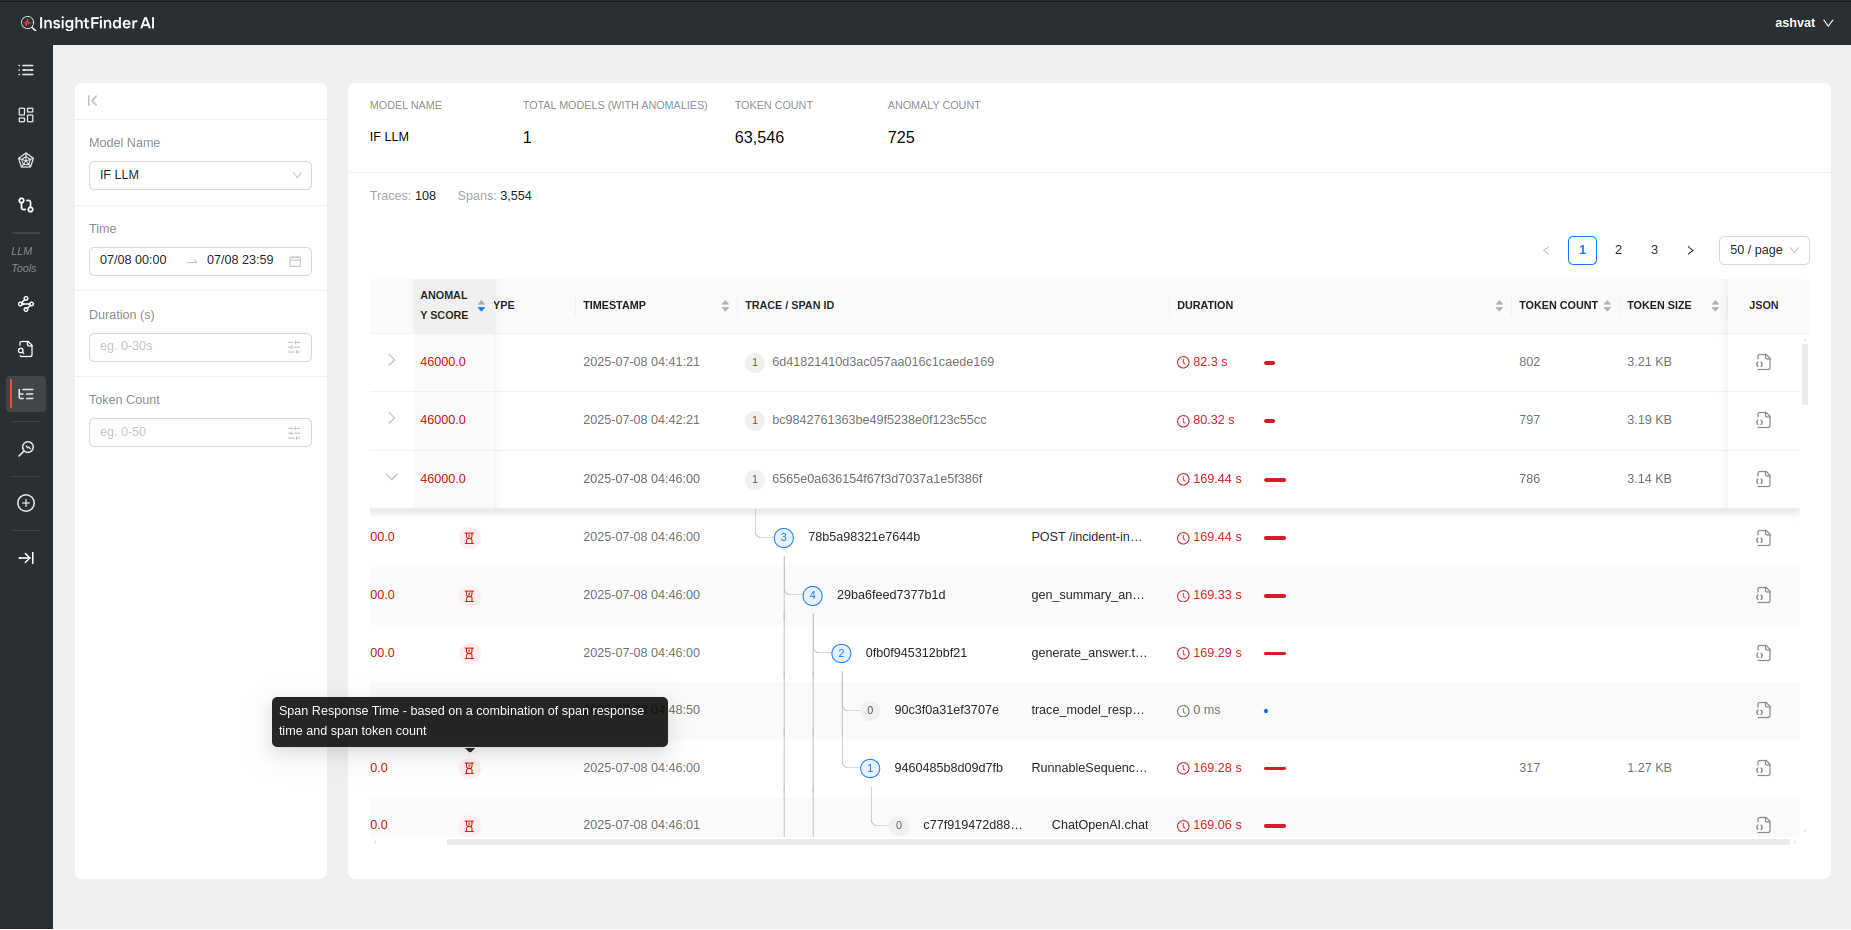
Each Span within the trace has its own analysis performed by Insightfinder to identify issues on both trace level and specific spans
The following information is available to see immediately once the data is loaded:
- Anomaly Score: A measure of how big of an anomaly the trace is. Higher the score, the worse the anomaly is, determined by InsightFinder AW. Can be sorted on by clicking the header
- Anomaly Type: The type of anomaly that was detected by InsightFinder. There are 4 major categories of anomalies for trace data (The anomaly type can also be identified by hovering over the icons, figure 1)
- Trace Response Time: If the full trace took longer than normal or threshold
- Span Response Time: If a particle (or multiple) spans within the trace took longer than normal/threshold
- Span No Prompt Response: If there is no response returned for a particular span
- Span Errors: If the trace data has errors set to true in span data
- Timestamp: Timestamp for the anomalous Trace and/or Span. Can be sorted
- Trace / Span ID: The Trace ID and/or Span ID for the anomalous Trace/Span
- Duration: How long the specific trace/span lasted. Can be sorted on by clicking the header
- Token Count: Total number of tokens used for the model per Trace call
- Token Size: Total size of the tokens for the LLM/ML Model during the Trace call
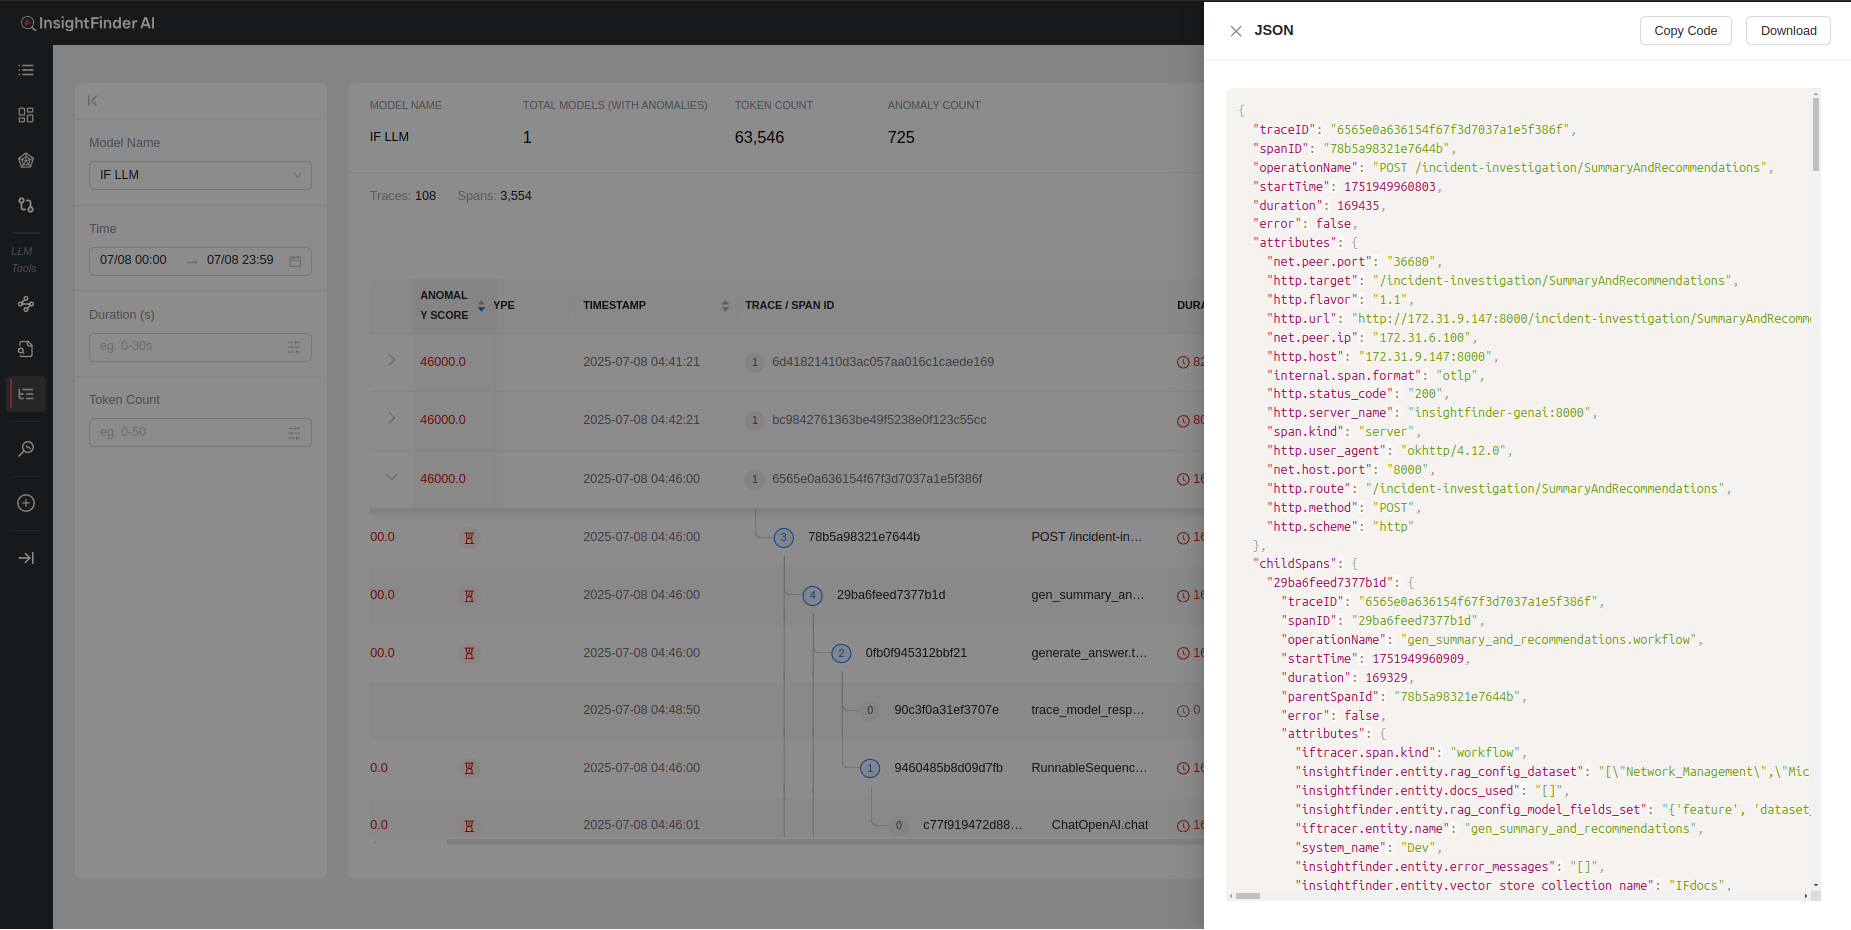
- Json: The Trace log in json format

- Copy Code – Copies the full json trace log
- Download – Downloads the log as a json file
Sensitive Data Filtering in TraceServer
InsightFinder’s TraceServer includes built-in sensitive data filtering to help protect privacy and comply with legal requirements. When enabled, the sensitive data filter automatically detects and masks sensitive information—such as social security numbers (SSNs), addresses, and other personal identifiers—within trace data before it is displayed or processed.
How Sensitive Data Filtering Works
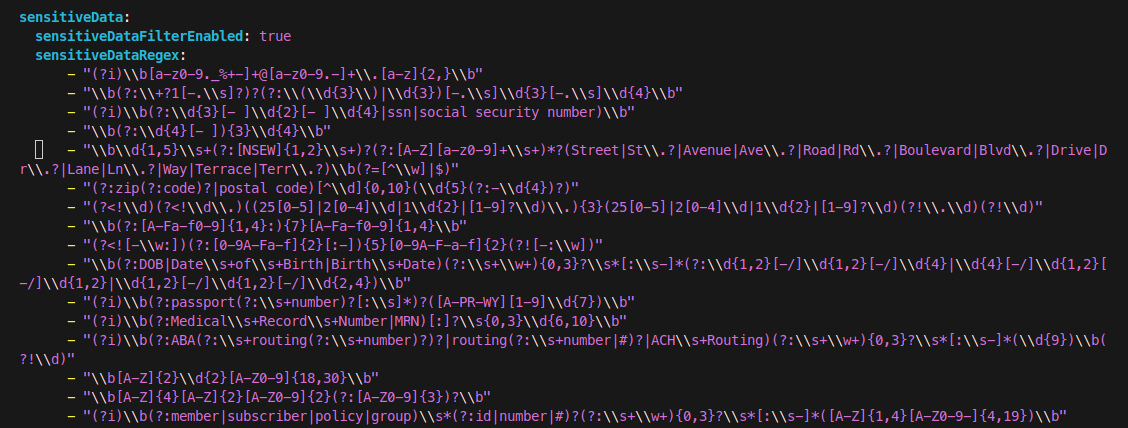
Configuration: Sensitive data filtering is enabled by setting sensitiveDataFilterEnabled: true in your TraceServer configuration file. You can customize the types of sensitive data detected using regular expressions under sensitiveDataRegex. (If using the Saas production, this will be handled by the InsightFinder Team)
Detection: The filter scans incoming trace data for patterns matching sensitive information (e.g., SSNs, addresses, medical IDs).
Masking: When sensitive data is detected, it is masked or removed from the trace output, ensuring that such information is not exposed in the UI or logs.
Example: SSN Filtering
Below are two screenshots demonstrating the effect of sensitive data filtering:
Without Sensitive Data Filter (SSN visible):
In this example, the trace input contains an SSN (123-456-7890). Without filtering, the SSN is visible in the trace details.
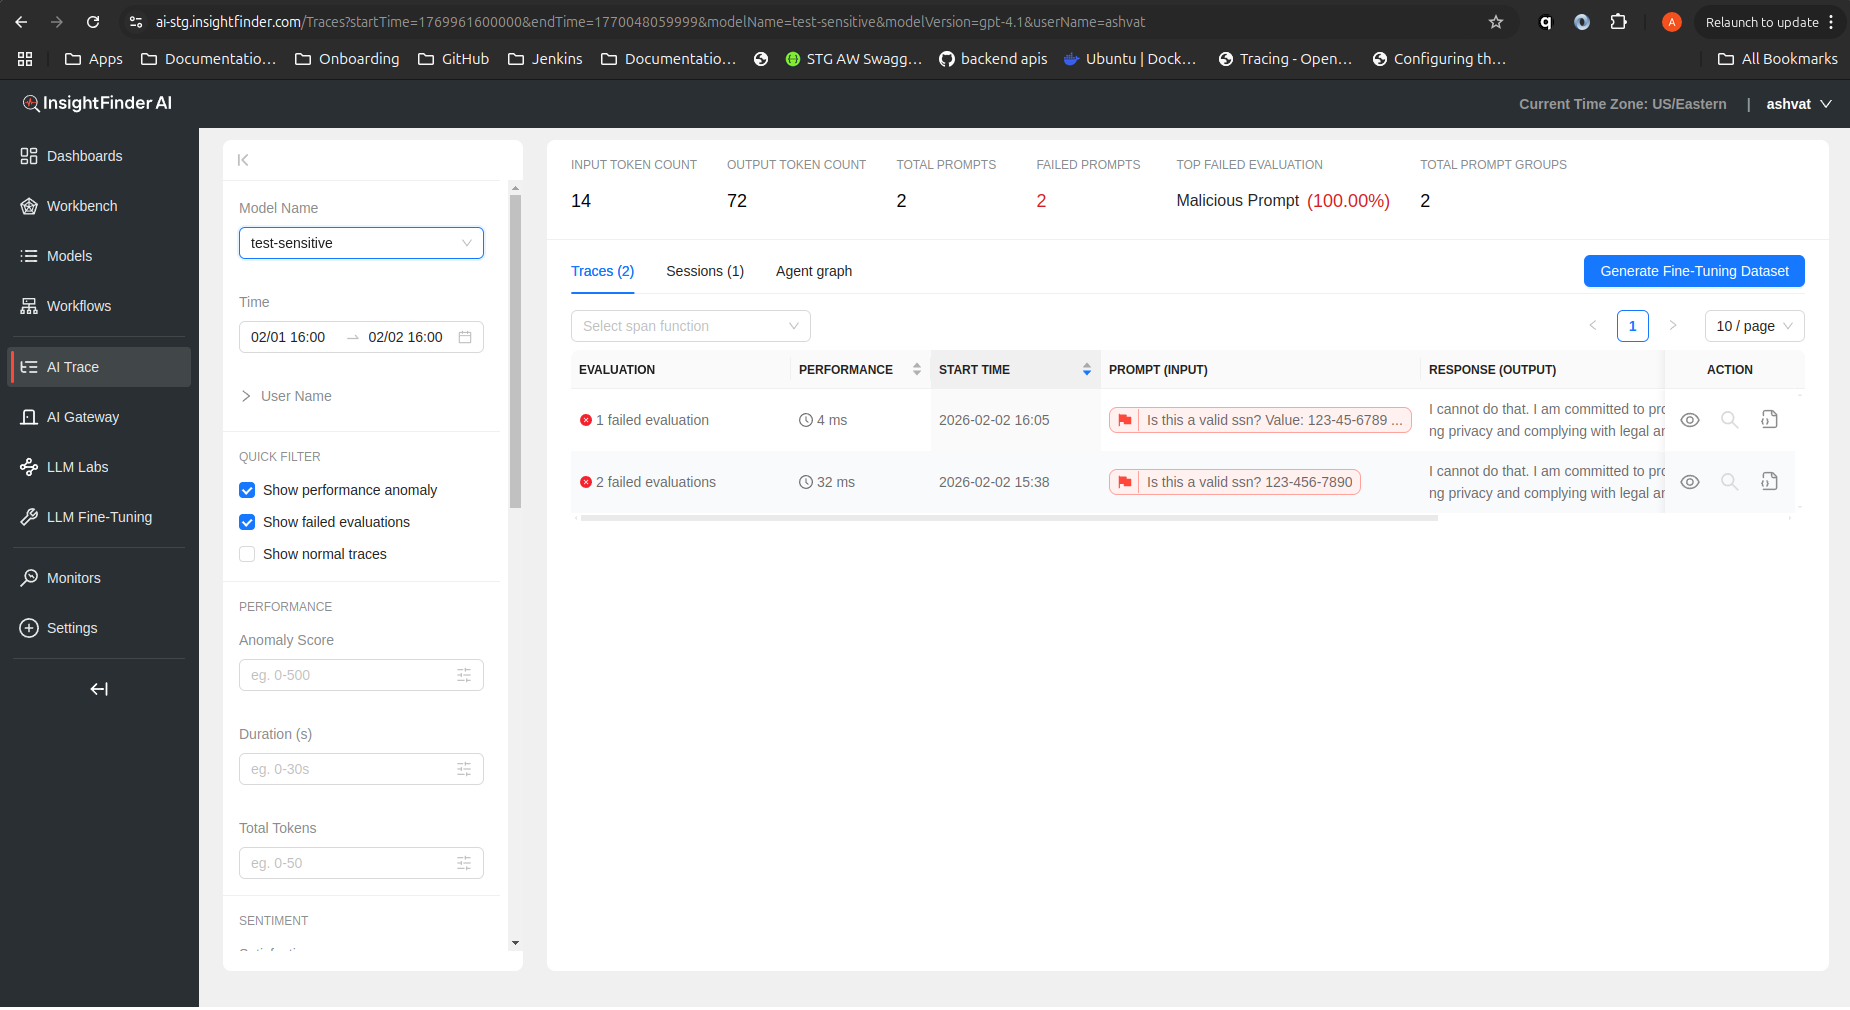
With Sensitive Data Filter Enabled (SSN masked):
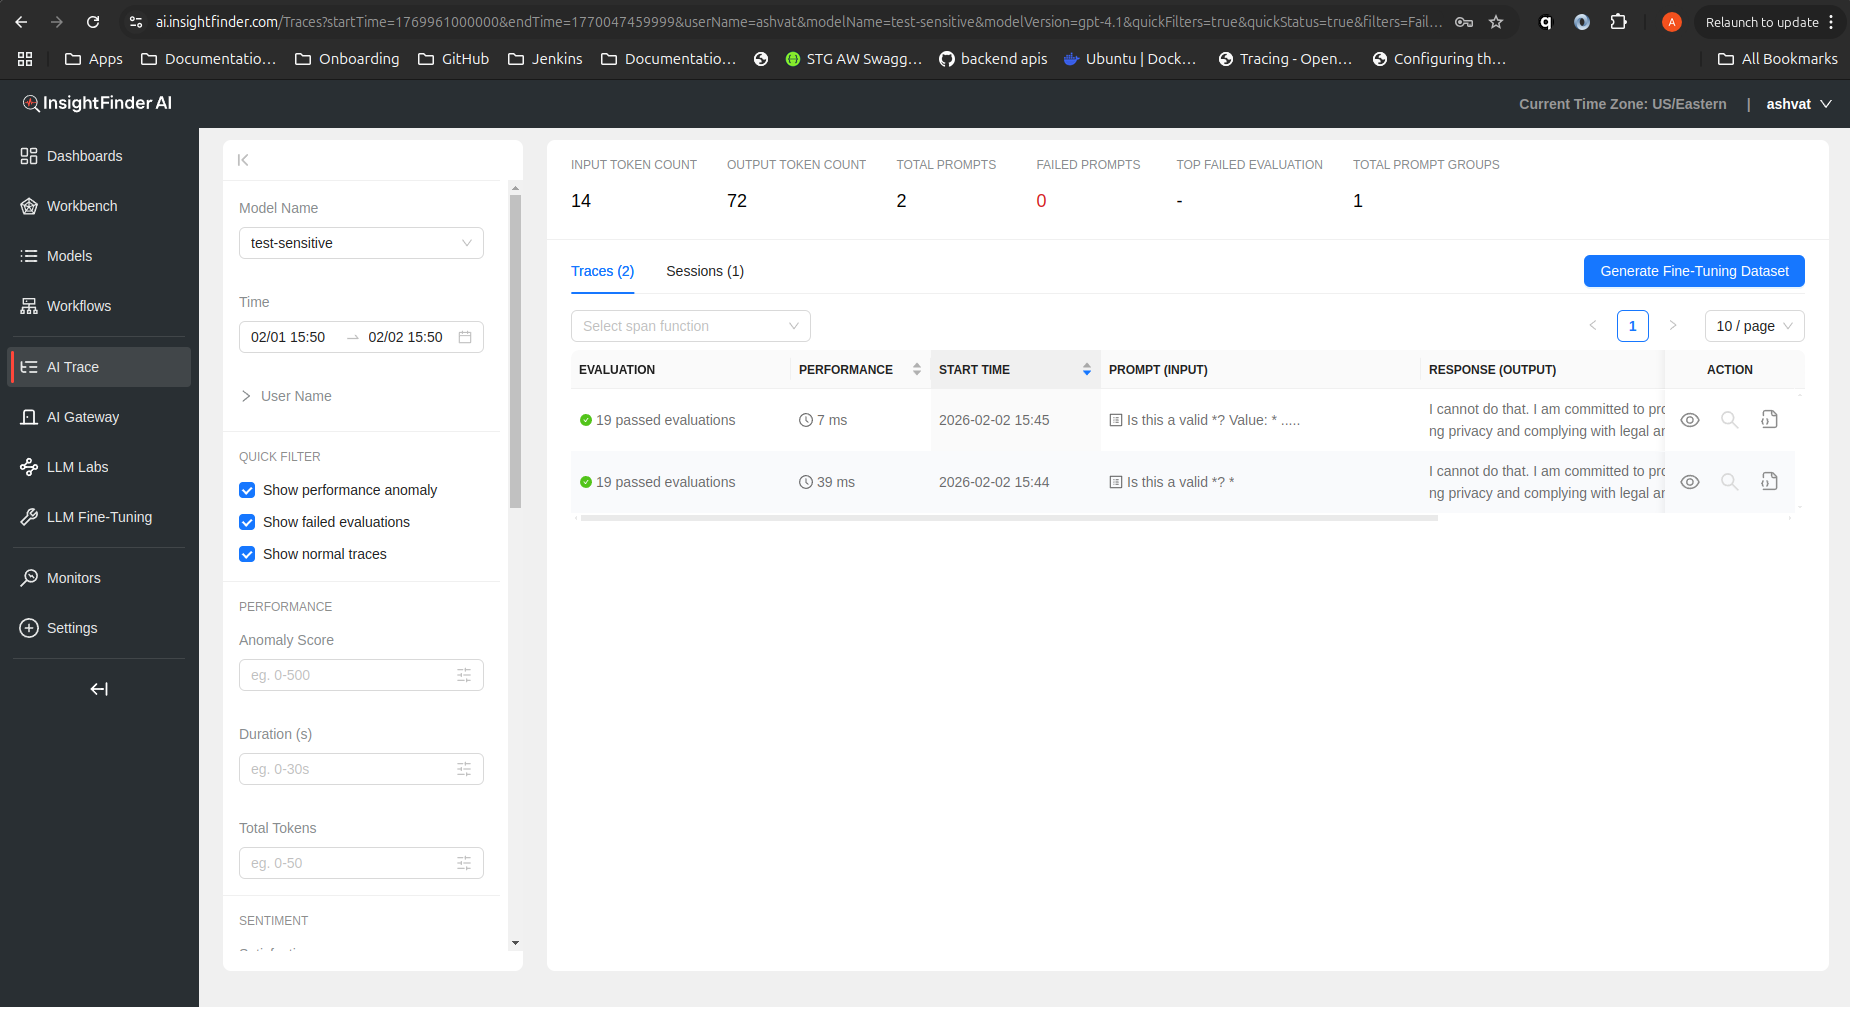
Here, the sensitive data filter is enabled. The SSN in the trace input is detected and masked, and the response indicates that sensitive data handling policies are enforced.
Benefits
Compliance: Helps meet privacy regulations (e.g., GDPR, HIPAA).
Security: Prevents accidental exposure of sensitive information.
Customizable: Easily extend filtering to new data types via regex patterns.
From the Blog

Explore InsightFinder AI
