Welcome to InsightFinder AI Observability Docs!
Categories
Monitors
Overview
Monitors in InsightFinder AI WatchTower provide comprehensive observability across different aspects of your AI/ML systems. Each monitor type is designed to detect specific issues and anomalies, ensuring optimal performance, safety, and reliability of your models and data pipelines.
Monitor Types Available
- Data Drift: Monitors changes in input data distribution over time
- Data Quality: Ensures data consistency, completeness, and accuracy
- LLM Performance: Tracks response times and errors in LLM operations
- LLM Trust & Safety: Evaluates LLM outputs for bias, toxicity, and safety
- Model Drift: Detects degradation in model performance over time
- Model Performance: Monitors model latency, errors, and accuracy metrics
- Model Bias: Measures fairness and bias in model predictions
- Model Availability: Tracks system uptime and availability metrics
Data Drift Monitor
Overview
Data drift is when the input data changes over time, potentially affecting model accuracy. This monitor helps detect when your input data distribution deviates from expected patterns.
Configuration Process
Step 1: Basic Monitor Setup
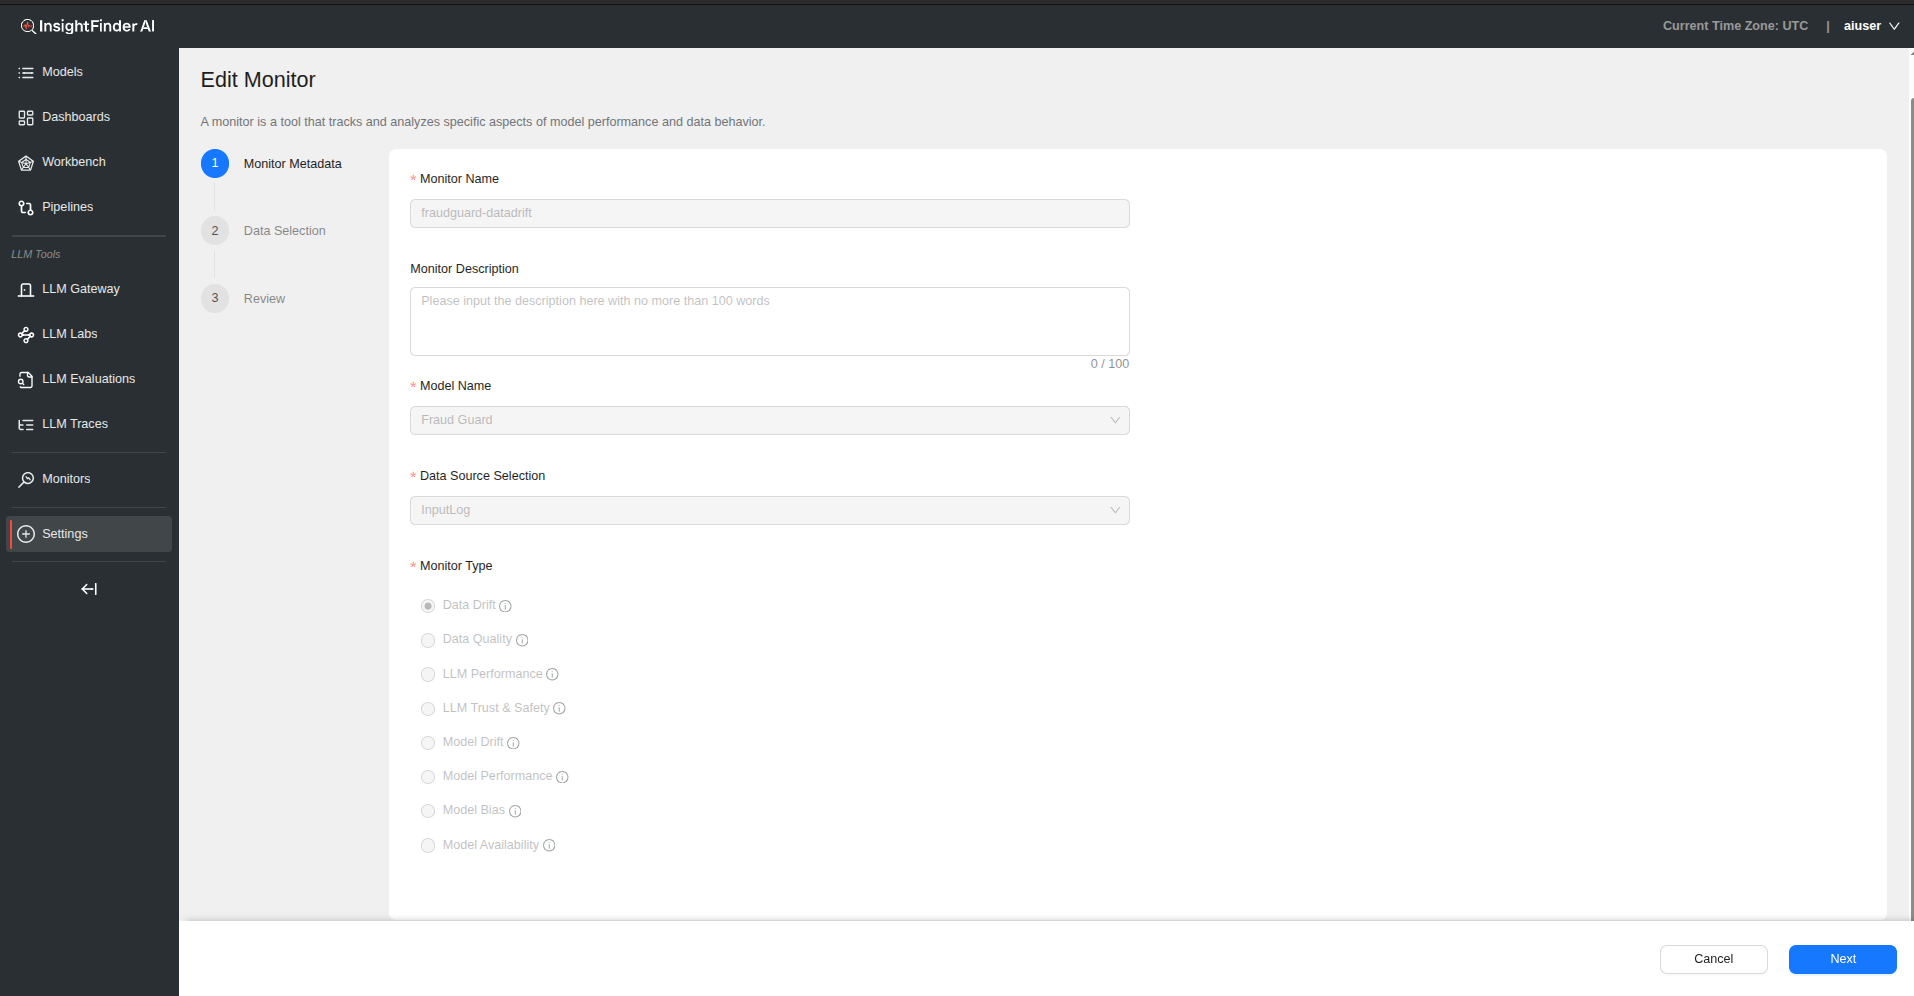
Monitor Name – Provide a descriptive name for your data drift monitor
Monitor Description – Add detailed description explaining the monitor’s purpose
Model Name – Select the model associated with this data drift monitoring
Data Source Selection – Choose the data source that feeds into your model
– This determines what data will be analyzed for drift
Monitor Type – Select “Data Drift” from the monitor type
Step 2: Data Selection Configuration
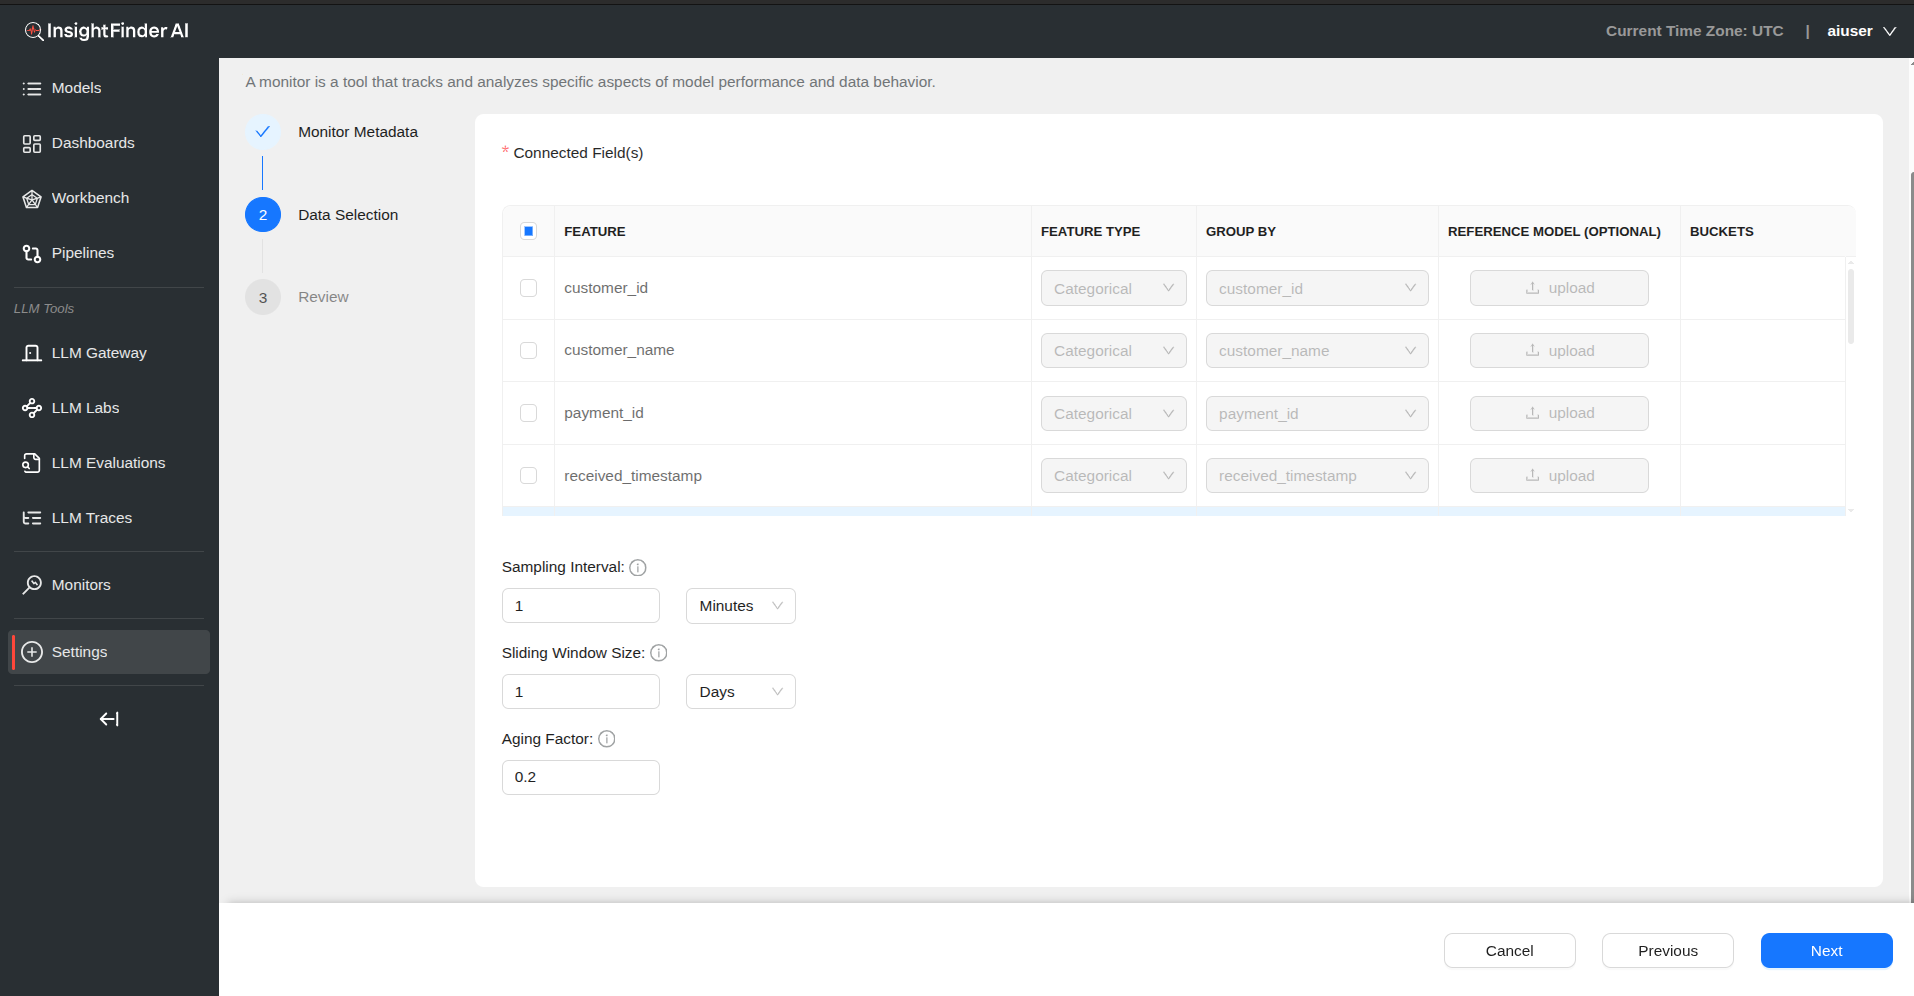
Connected Fields – Fields are automatically populated from your selected data source – Review available fields for drift monitoring
Field Configuration Table
| Field | Description |
|---|---|
| Feature | Select specific fields from your data source to monitor |
| Feature Type | Choose between Numerical or Categorical data types |
| Group By | Select field to group analysis by (dropdown includes all data source features) |
| Reference Model (Optional) | Upload baseline model using the upload button |
| Buckets | Configure value ranges for numerical features |
Bucket Configuration – Click “Configure” in the Buckets column for numerical features – Define Min and Max values for each bucket – Add multiple buckets as needed for comprehensive analysis
Step 3: Monitoring Parameters
Sampling Interval – Defines the time gap between data points used for monitoring – Provide value and select time unit (Days, Hours, Minutes)
Sliding Window Size – Specifies the size of the moving window used for calculating metrics – Determines how much historical data to include in drift calculations
Aging Factor – Determines the weight given to older data when calculating trends – Higher values give more weight to recent data
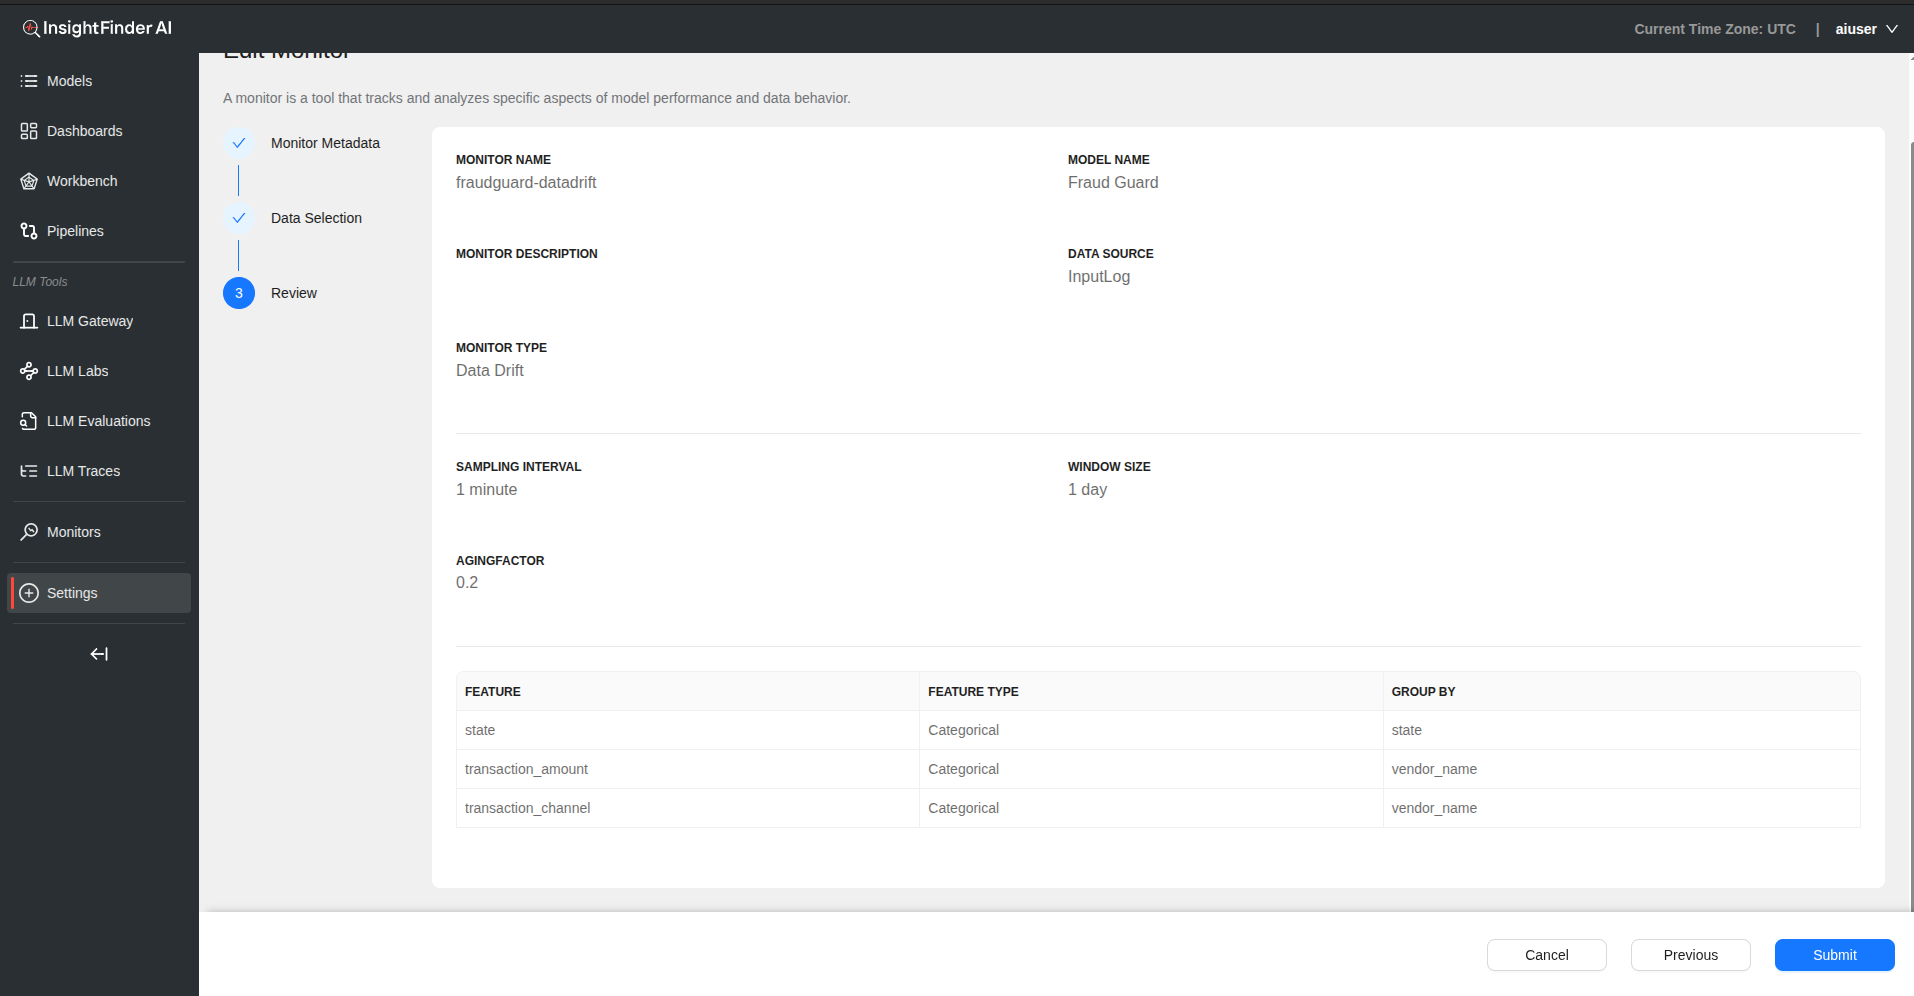
Step 4: Review and Submit
- Click “Next” to review your configuration

- Verify all settings are correct
- Click “Submit” to create the data drift monitor
Data Quality Monitor
Overview
Automatically detects field types from source data and monitors for data gaps, outliers, sudden changes, and type mismatches to ensure data consistency and accuracy.
Configuration Process
Step 1: Basic Monitor Setup
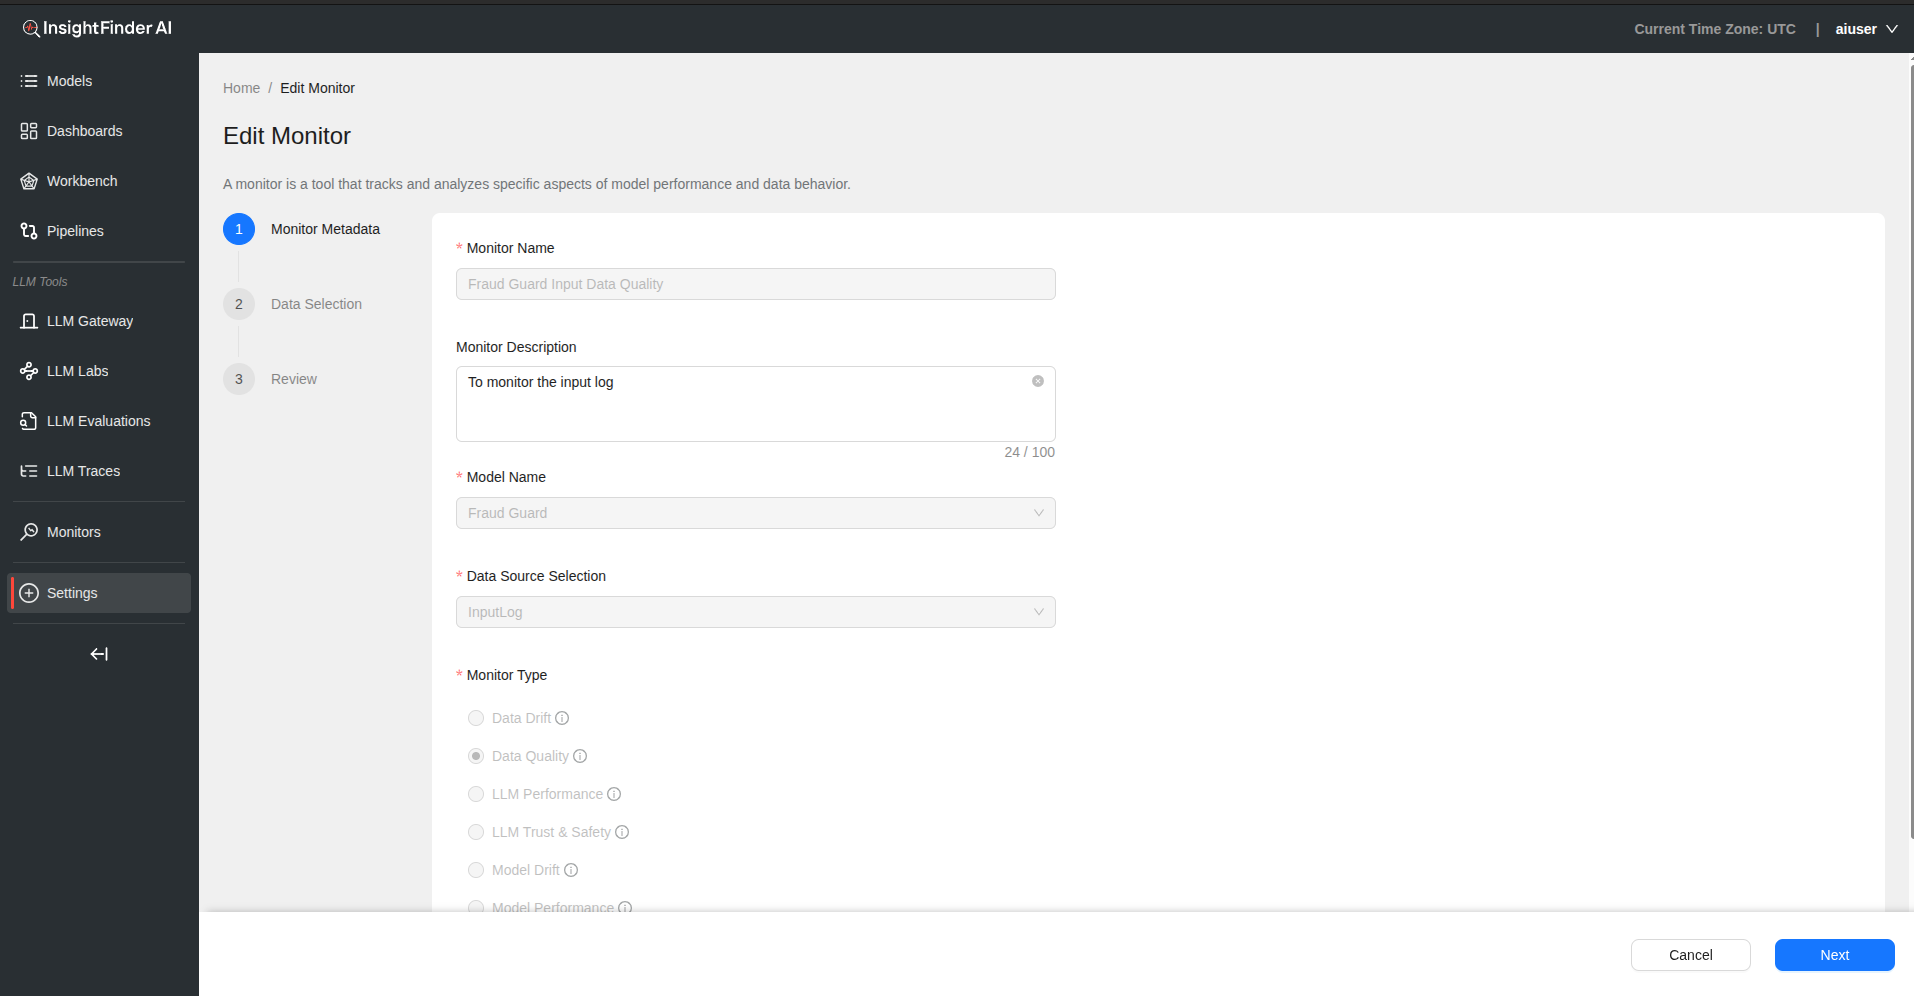
Monitor Name – Provide a descriptive name for your data quality monitor
Monitor Description – Add detailed description explaining data quality aspects being monitored
Model Name – Select the model associated with this data quality monitoring
Data Source Selection – Choose the data source to monitor for quality issues
Monitor Type – Select “Data Quality” from the monitor type
Step 2: Data Selection Configuration
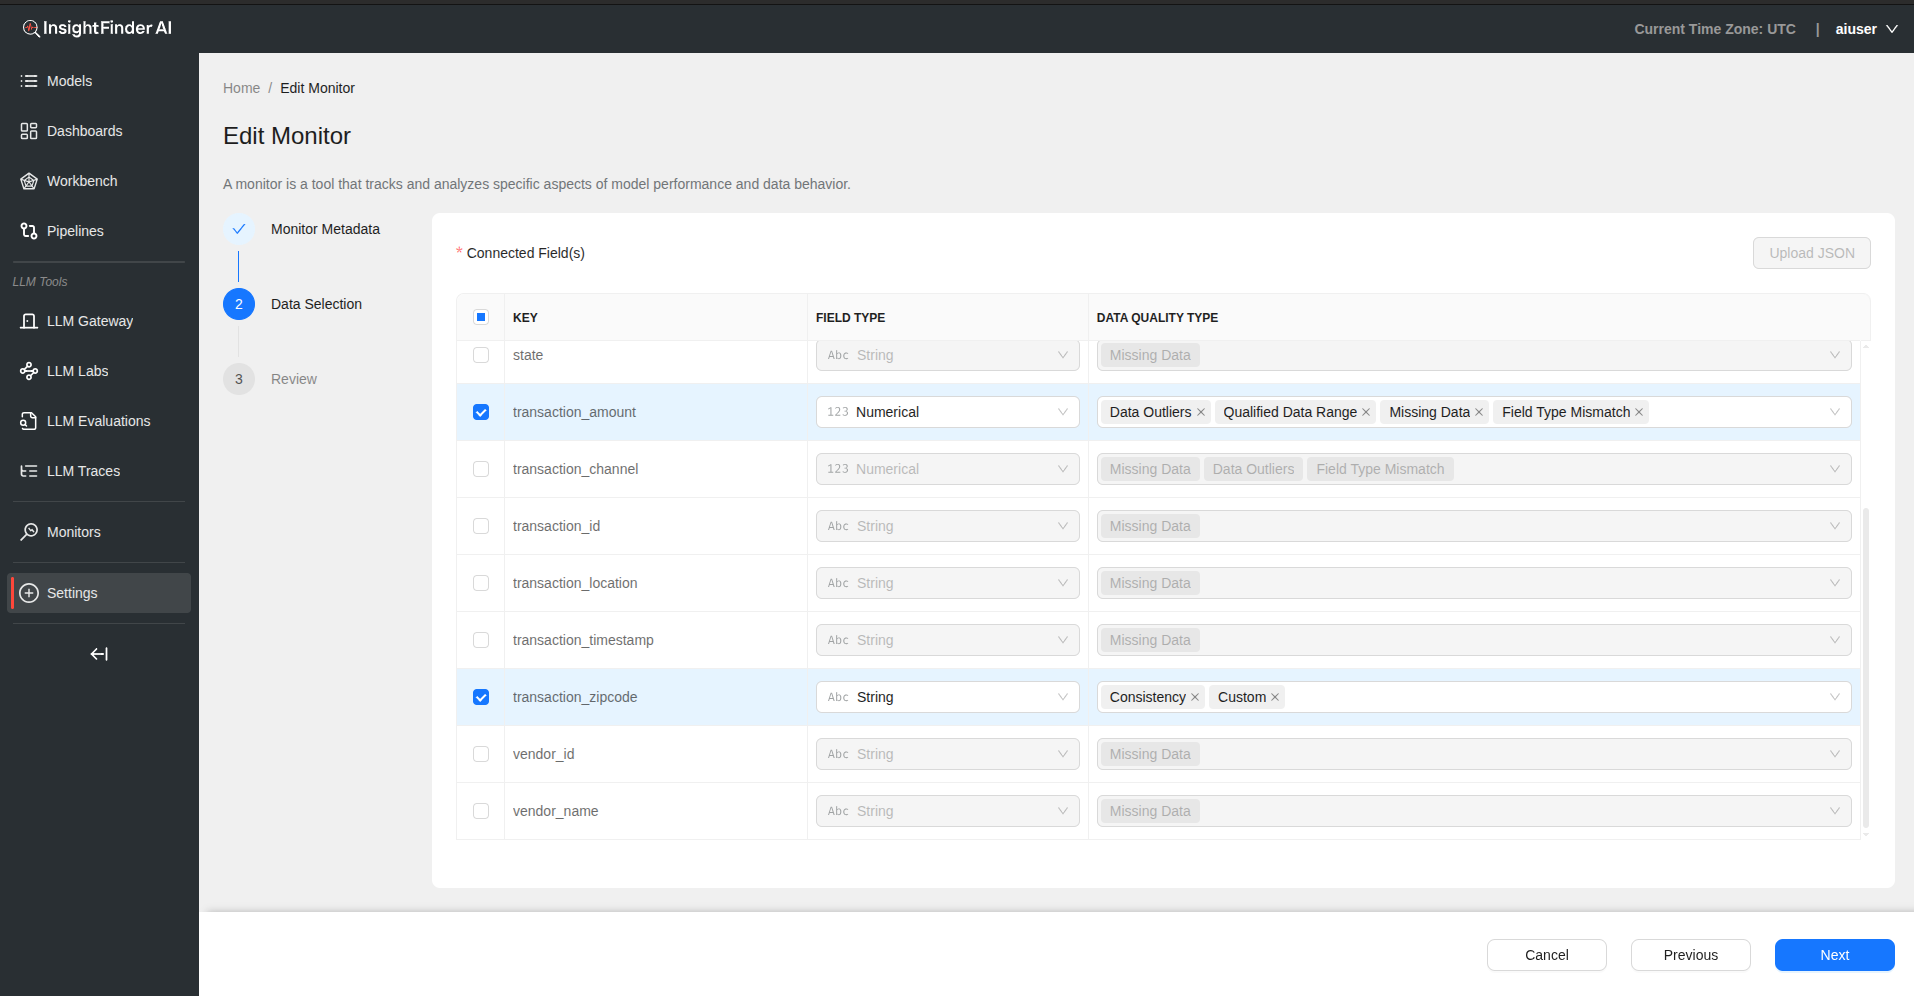
Connected Fields – Fields are automatically populated from your selected data source
Field Configuration Table
| Field | Description |
|---|---|
| Key | Select specific fields from your data source |
| Field Type | Choose String, Numerical, or Categorical |
| Data Quality Type | Select quality check type (see options below) |
Data Quality Type Options
1. Consistency
- Additional dropdown shows keys from data source
- Select reference keys for consistency checking
- Use “Add Key” button to include multiple consistency checks
2. Missing Data
- Monitors for null values, empty fields, or missing data points
- Automatically detects data completeness issues
3. Field Type Mismatch
- Checks if data types match expected formats
- Detects when strings appear in numerical fields, etc.
4. Custom
- Provide custom name for the quality check
- Define regex pattern for custom validation rules
- Allows for domain-specific quality checks
Optional JSON Upload – Upload JSON file to define additional quality rules – Provides more complex validation schemas
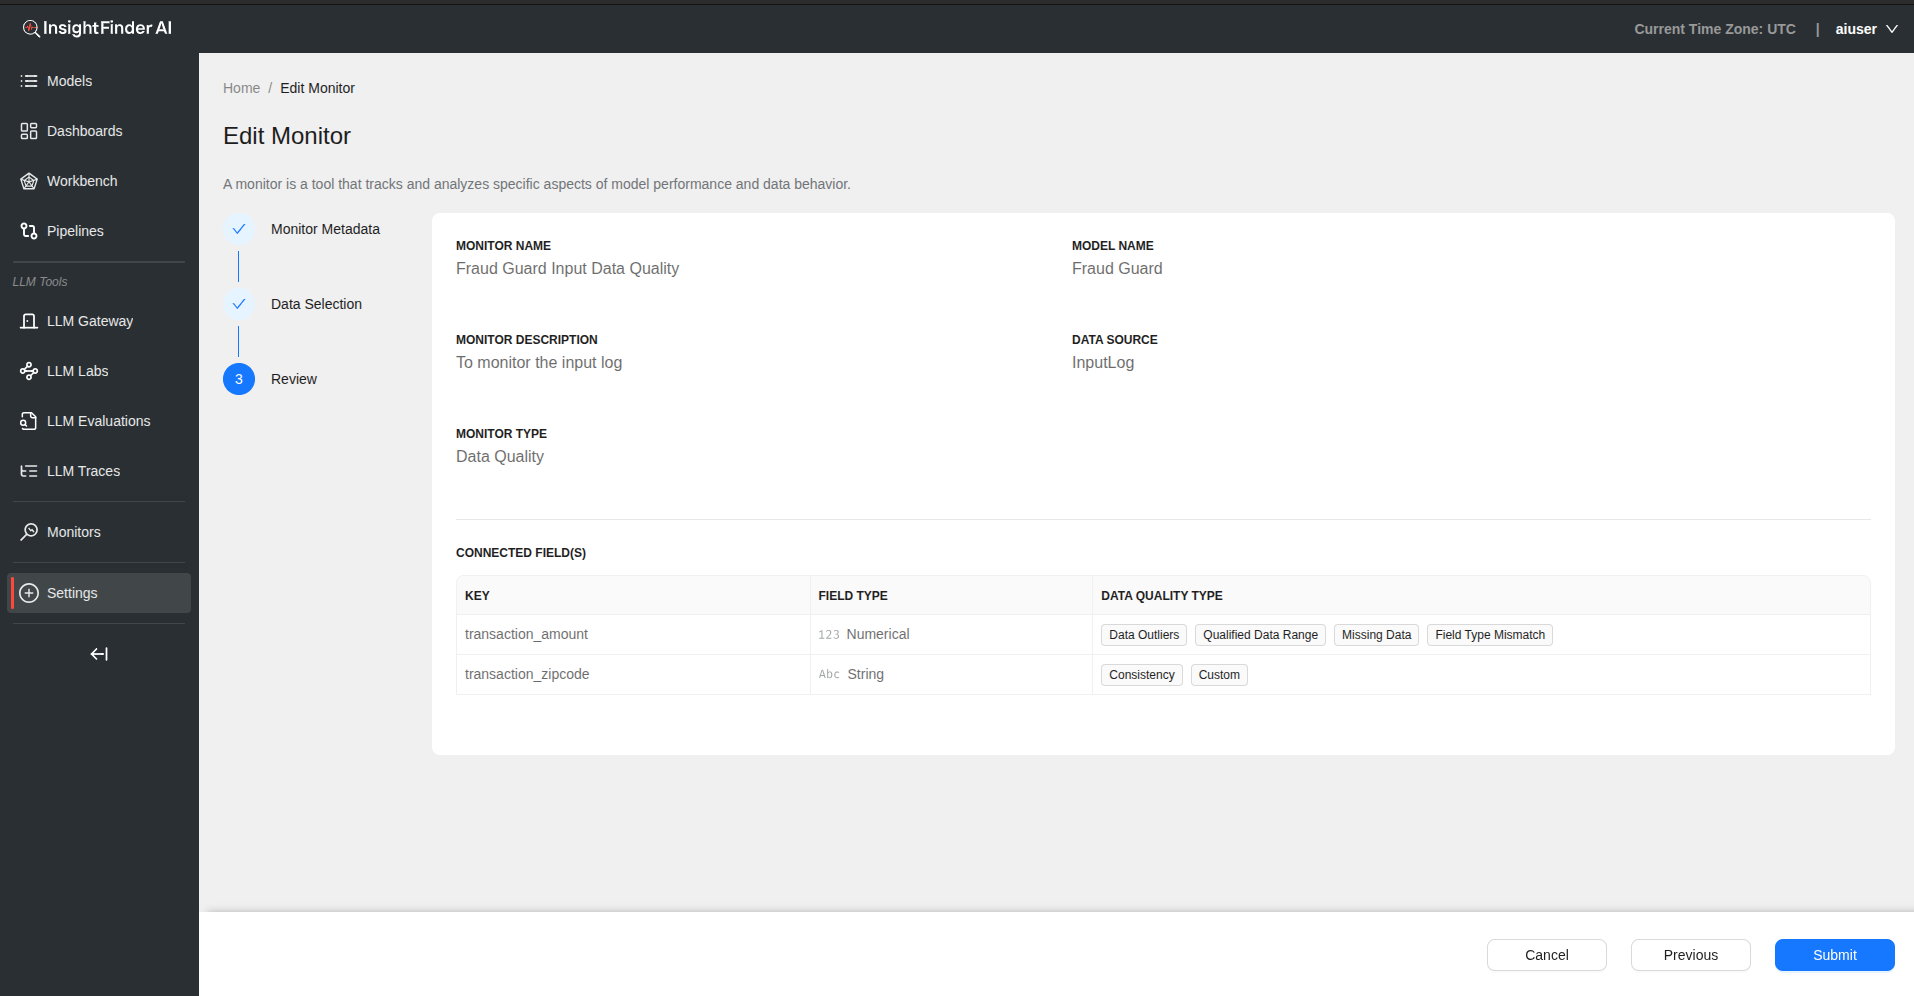
Step 3: Review and Submit
- Click “Next” to review your configuration
- Verify all quality checks are properly configured
- Click “Submit” to create the data quality monitor
LLM Performance Monitor
Overview
The LLM performance monitor automatically detects response time issues with spans and traces, missing prompt responses and spans with errors. This monitor is automatically created when the LLM Labs model is created.
Configuration Process
Step 1: Automatic Creation

This monitor is automatically created when you create an LLM Labs model. No manual setup is required for basic functionality.
Step 2: Data Selection Configuration
Monitoring Checks The following monitoring checks automatically detect anomalies in spans and traces. Items are checked by default with recommended settings.
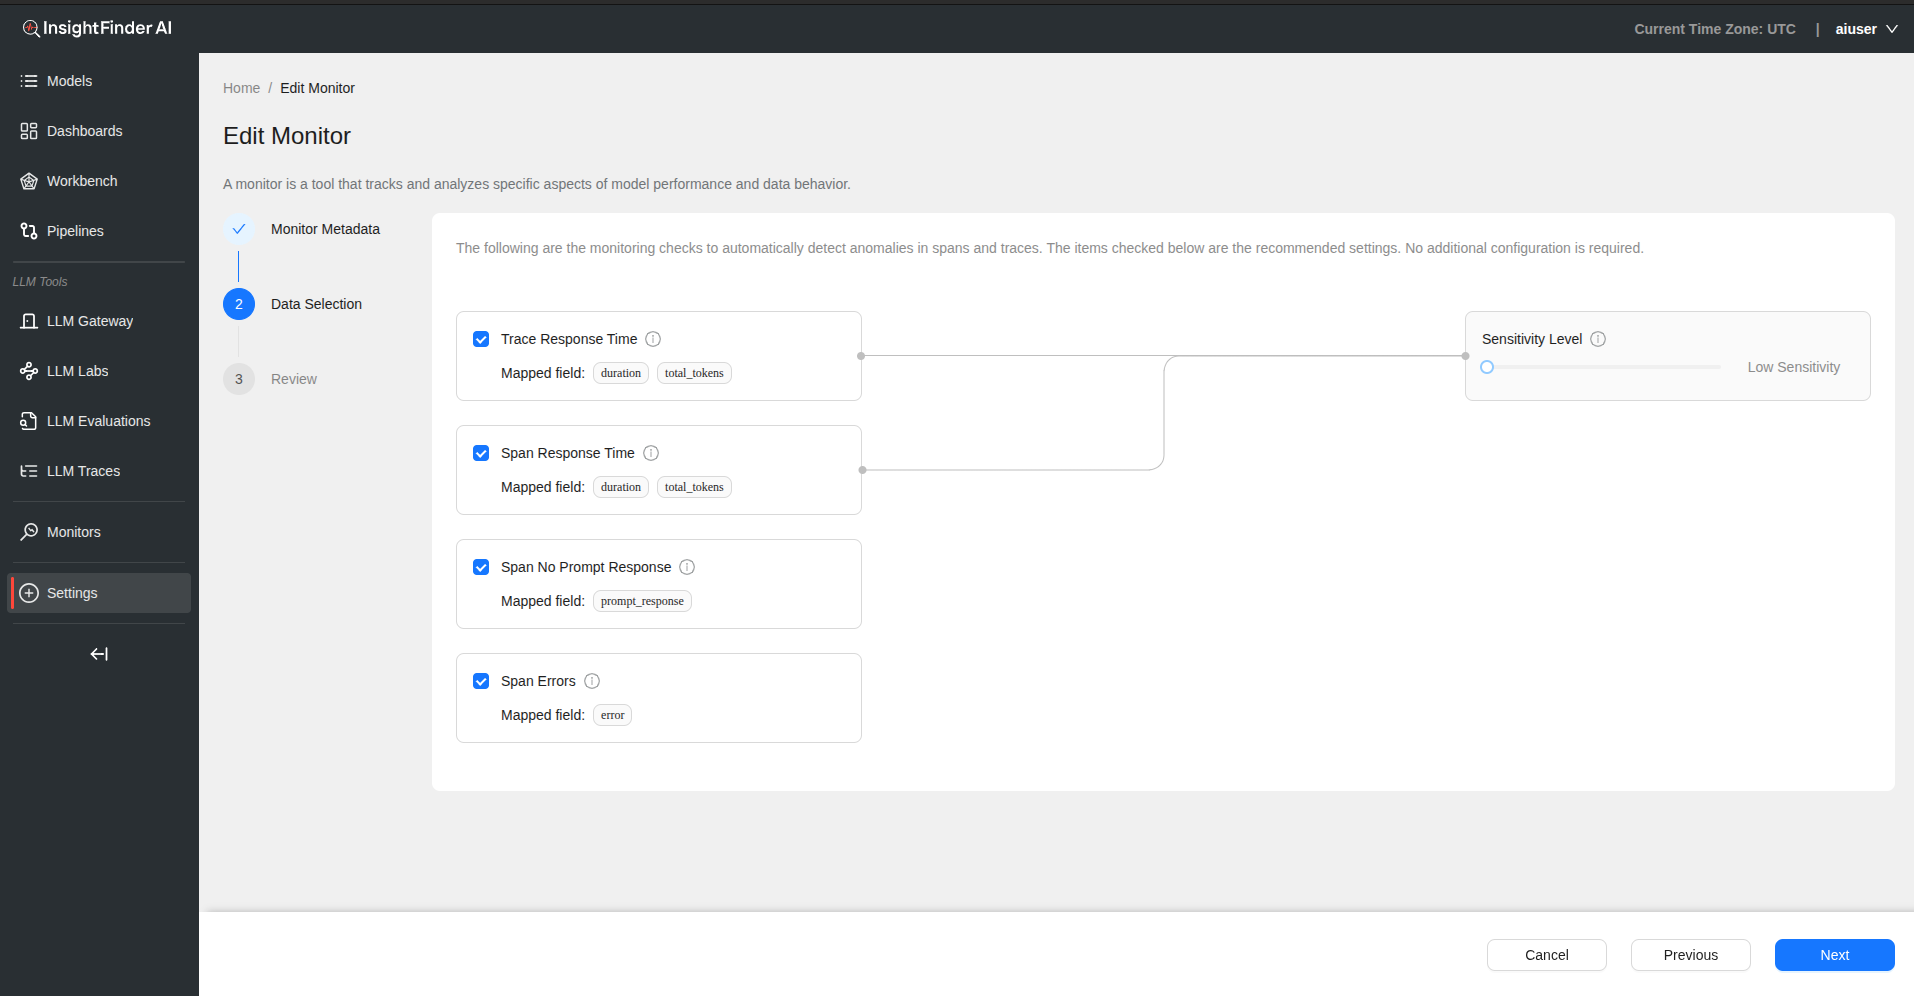
Available Monitoring Options
1. Trace Response Time
- Automatically detect anomalies based on trace response time and token count combination
- Enabled by default
2. Span Response Time
- Automatically detect anomalies based on span response time and token count combination
- Enabled by default
3. Span No Prompt Response
- Automatically generate anomalies when no prompt response is detected
- Enabled by default
4. Span Errors
- Automatically detect anomalies based on deviations in error rates
- Enabled by default
Users can enable or disable any of these checks using toggle buttons.
Step 3: Sensitivity Configuration
Sensitivity Level – Controls how closely the system tracks changes – Higher levels catch small changes – Lower levels focus on bigger shifts – Applies to duration and duration + total tokens calculations – Adjust using the sensitivity slider
Sensitivity Impact – Controls Trace Response Time detection – Controls Span Response Time detection – Does not affect Span No Prompt Response or Span Errors
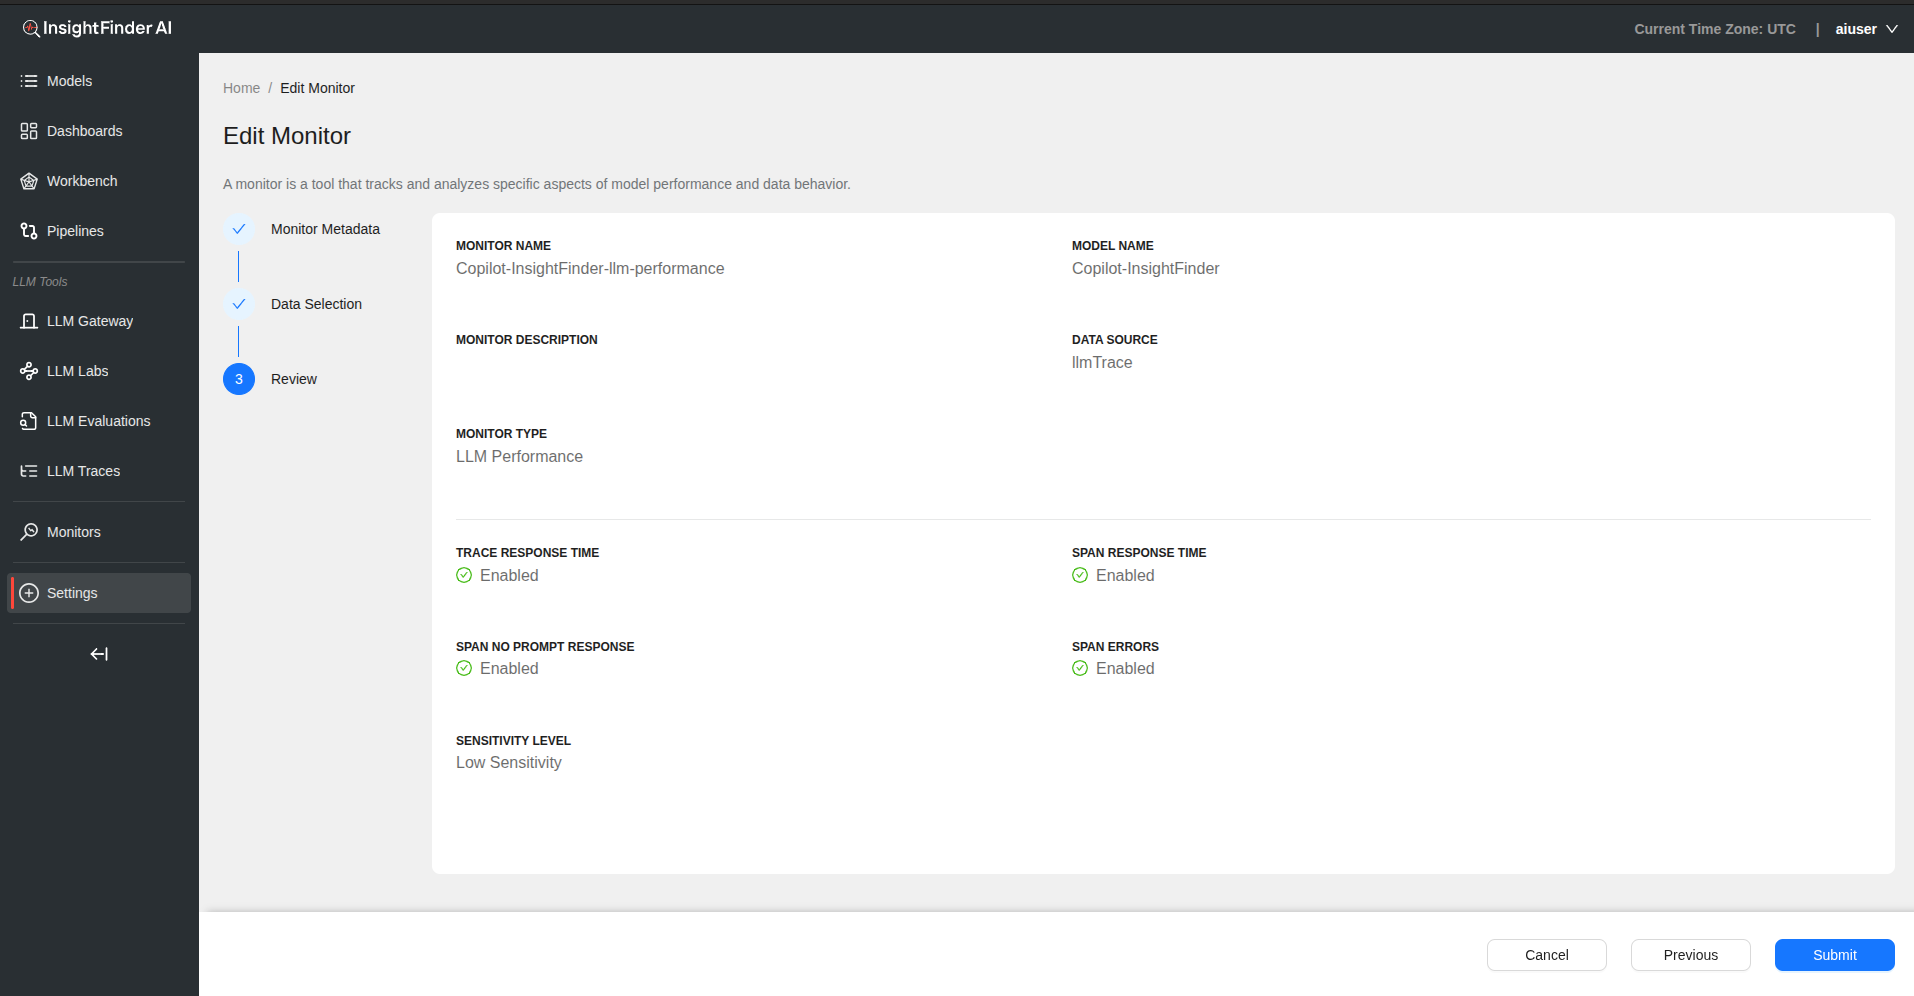
Step 4: Review and Submit
- Click “Next” to review monitoring configuration
- Verify sensitivity settings meet your requirements
- Click “Submit” to finalize the LLM performance monitor
LLM Trust & Safety Monitor
Overview
Detects biased, toxic, or malicious LLM inputs and outputs, including prompt attacks (e.g., jailbreaks), hallucinations, and privacy violations.
Configuration Process
Please refer to the LLM Evaluations Documentation for comprehensive details on configuring LLM Trust & Safety monitors, including:
- Evaluation types and categories
- Custom template configuration
- Safety and bias detection settings
- Hallucination and relevance monitoring
- Detailed setup instructions
Model Drift Monitor
Overview
Model drift refers to the degradation in the performance of a model over time. This occurs when the model’s predictive power decreases, usually due to data drift or changes in the real-world process the model is trying to predict.
Configuration Process
Step 1: Basic Monitor Setup

Monitor Name – Provide a descriptive name for your model drift monitor
Monitor Description – Add detailed description explaining model drift aspects being monitored
Model Name – Select the model to monitor for performance drift
Data Source Selection – Choose the data source containing model predictions and outcomes
Monitor Type – Select “Model Drift” from the monitor type
Step 2: Data Selection Configuration
Group By – Select field from data source to group analysis by – Allows for segmented drift analysis
Key Configuration
| Field | Description |
|---|---|
| Field Name | Select the field containing model outputs or metrics |
| Field Value | Specify the value or pattern to monitor |
| Metric | Choose appropriate drift metric from dropdown |
Note: Only one key can be selected per monitor. Choose the most critical metric for your use case.
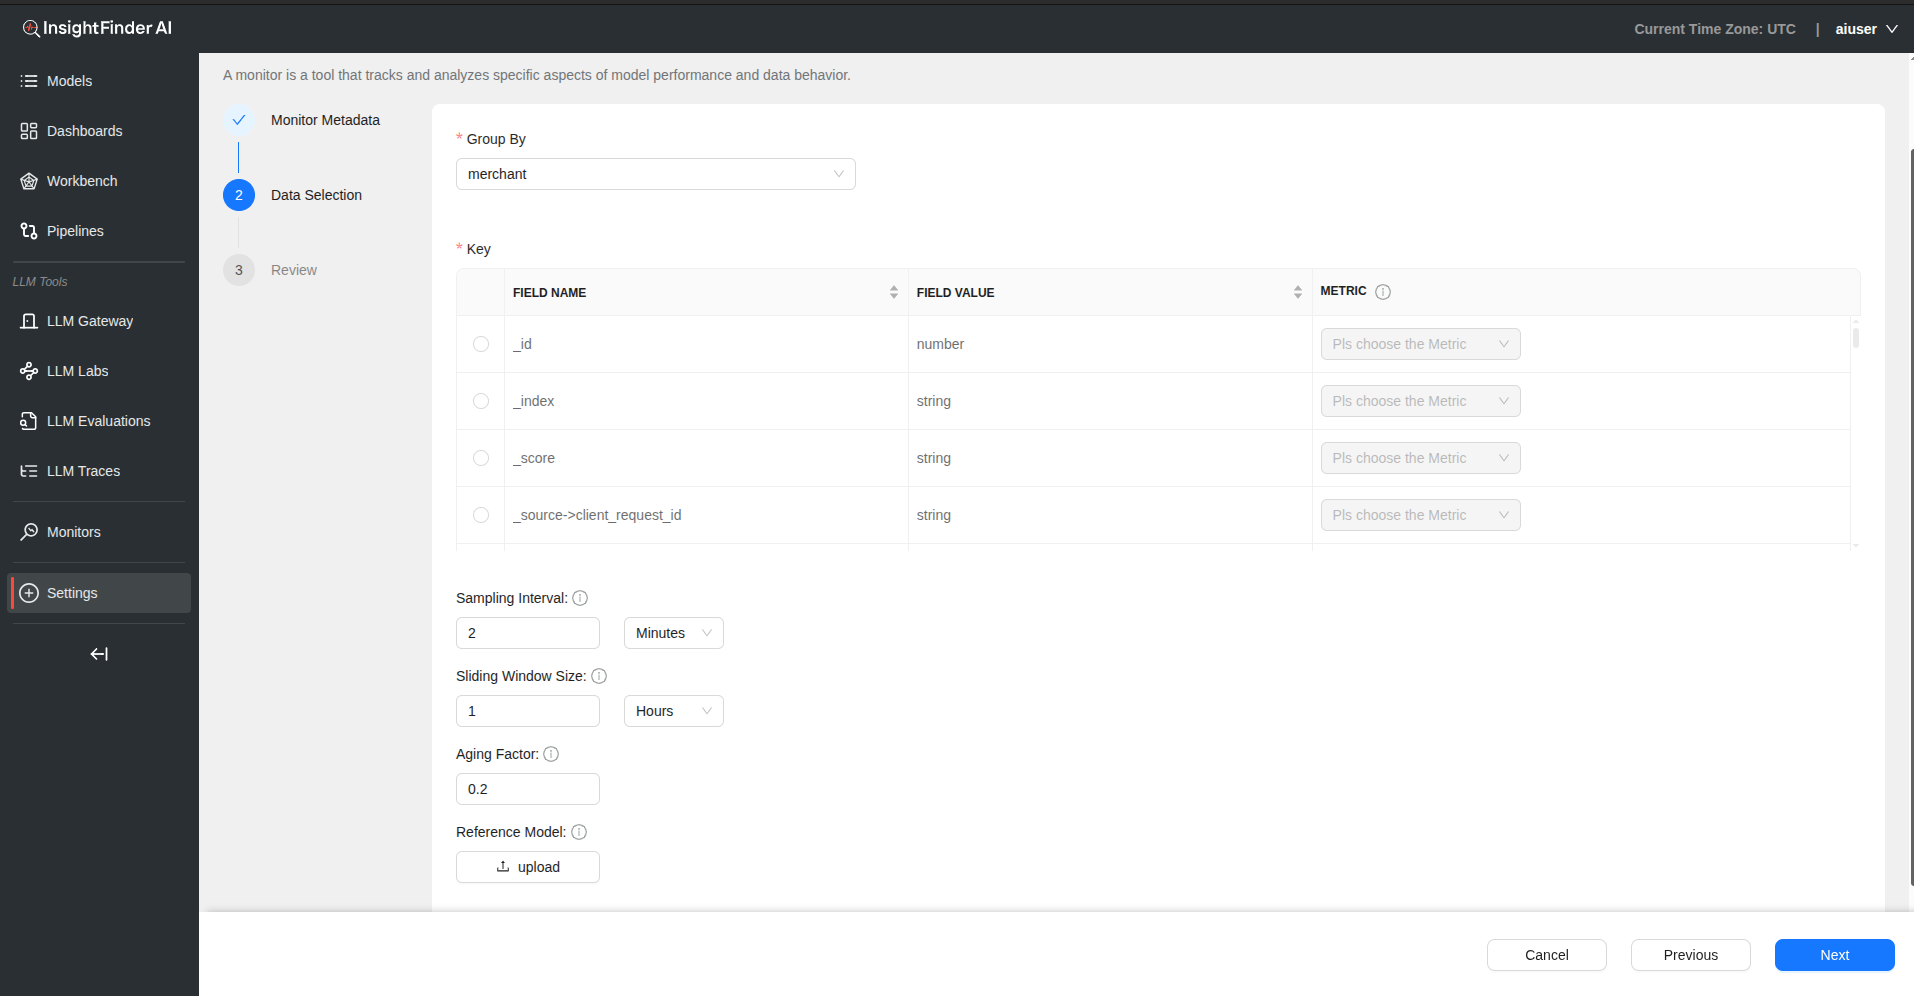
Step 3: Monitoring Parameters
Sampling Interval – Defines the time gap between data points used for monitoring – Provide value and select time unit (Days, Hours, Minutes)
Sliding Window Size – Specifies the size of the moving window used for calculating metrics – Determines temporal scope of drift detection
Aging Factor – Determines the weight given to older data when calculating trends – Balances historical context with recent performance
Reference Model – Upload baseline model for comparison to detect drift – Provides ground truth for drift calculations
Step 4: Advanced Settings (Optional)
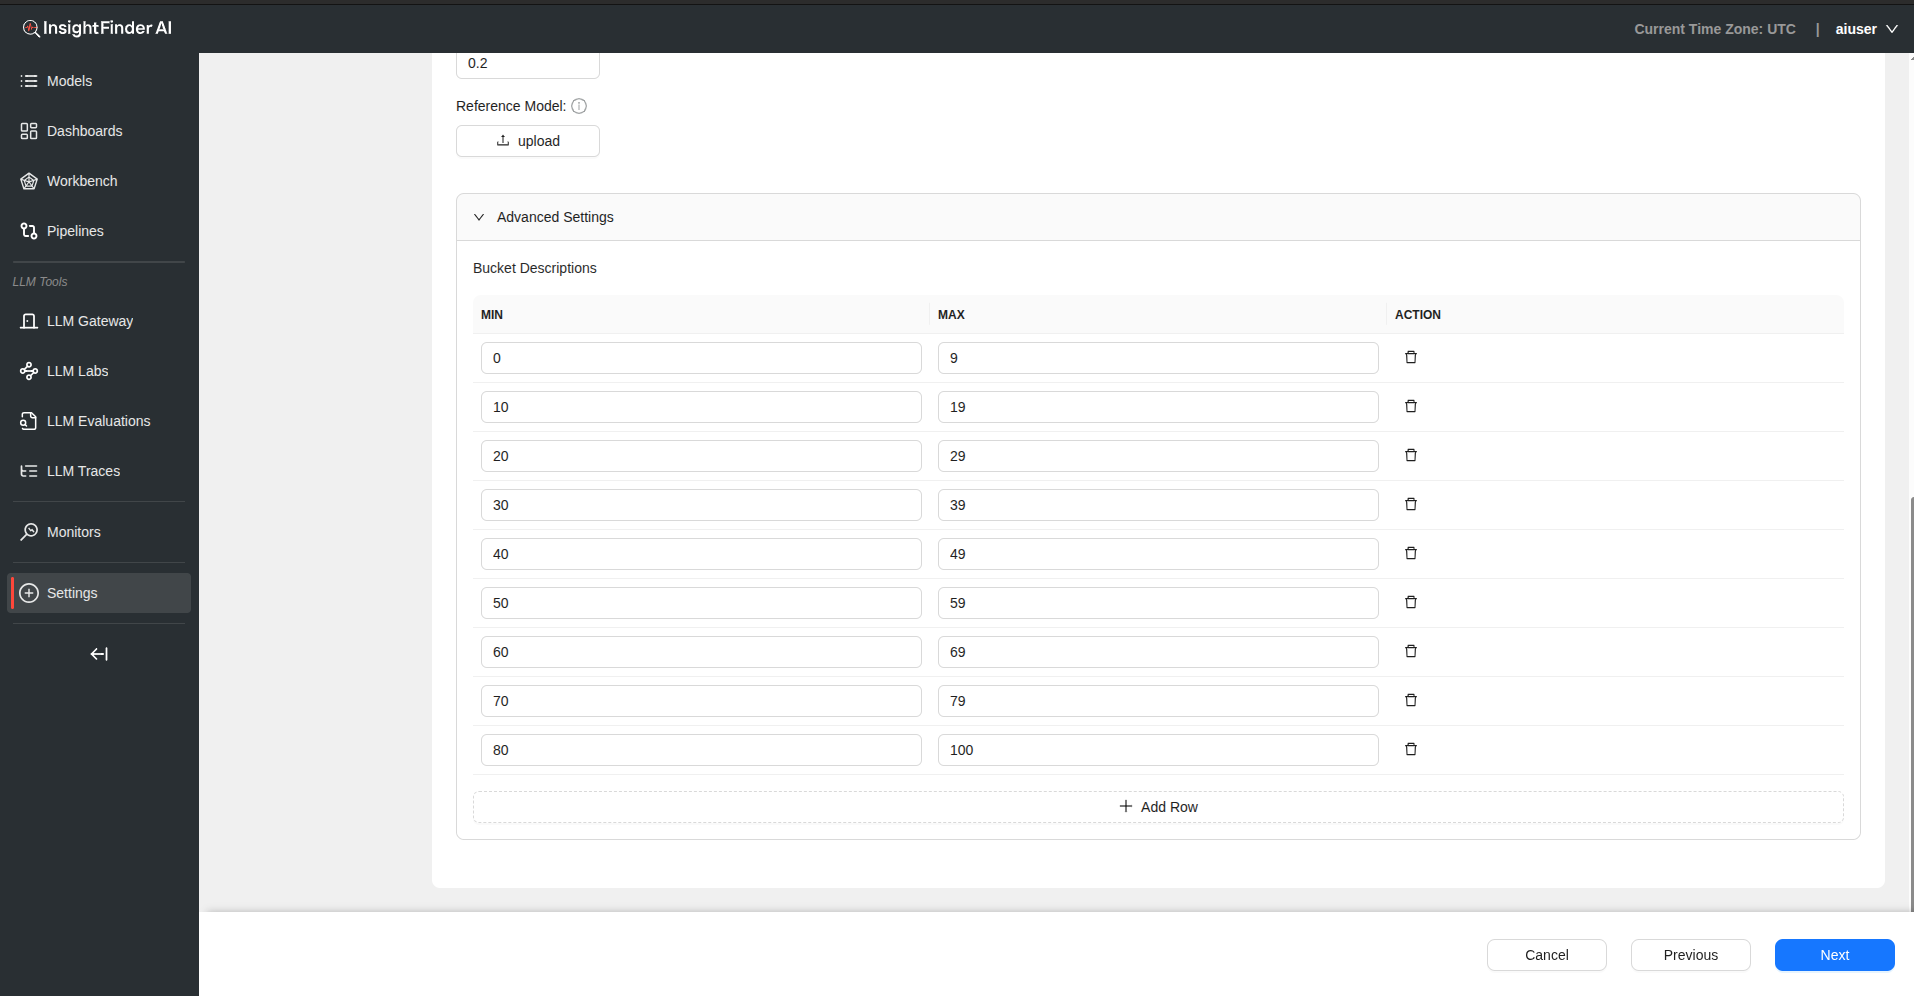
Buckets Configuration – Click on “Advanced Settings” to access bucket configuration – Add rows to define Min and Max values for buckets – Useful for categorical analysis of drift patterns
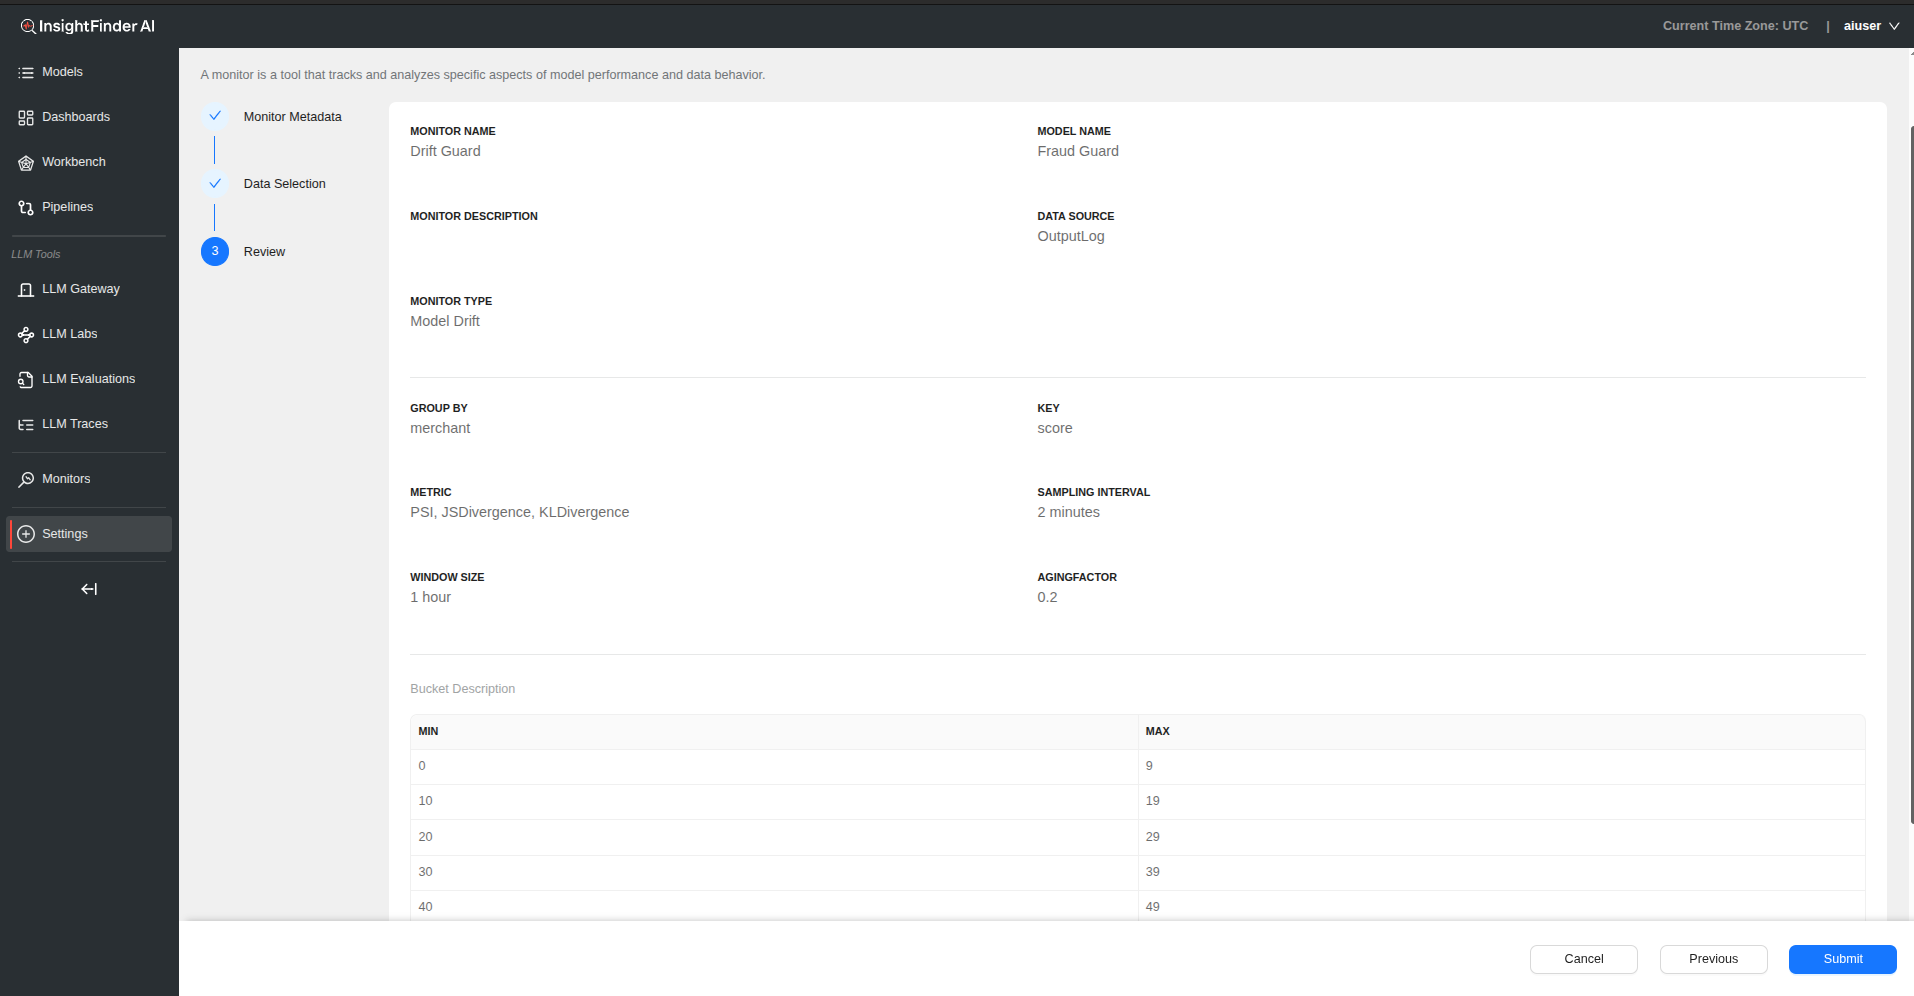
Step 5: Review and Submit
- Click “Next” to review configuration
- Verify all drift detection settings
- Click “Submit” to create the model drift monitor
Model Performance Monitor
Overview
This monitor is automatically created after pipeline integration is configured in Settings. It tracks model latency, errors, and invocation trends. No manual setup is required for basic functionality.
Configuration Process
Step 1: Basic Monitor Setup
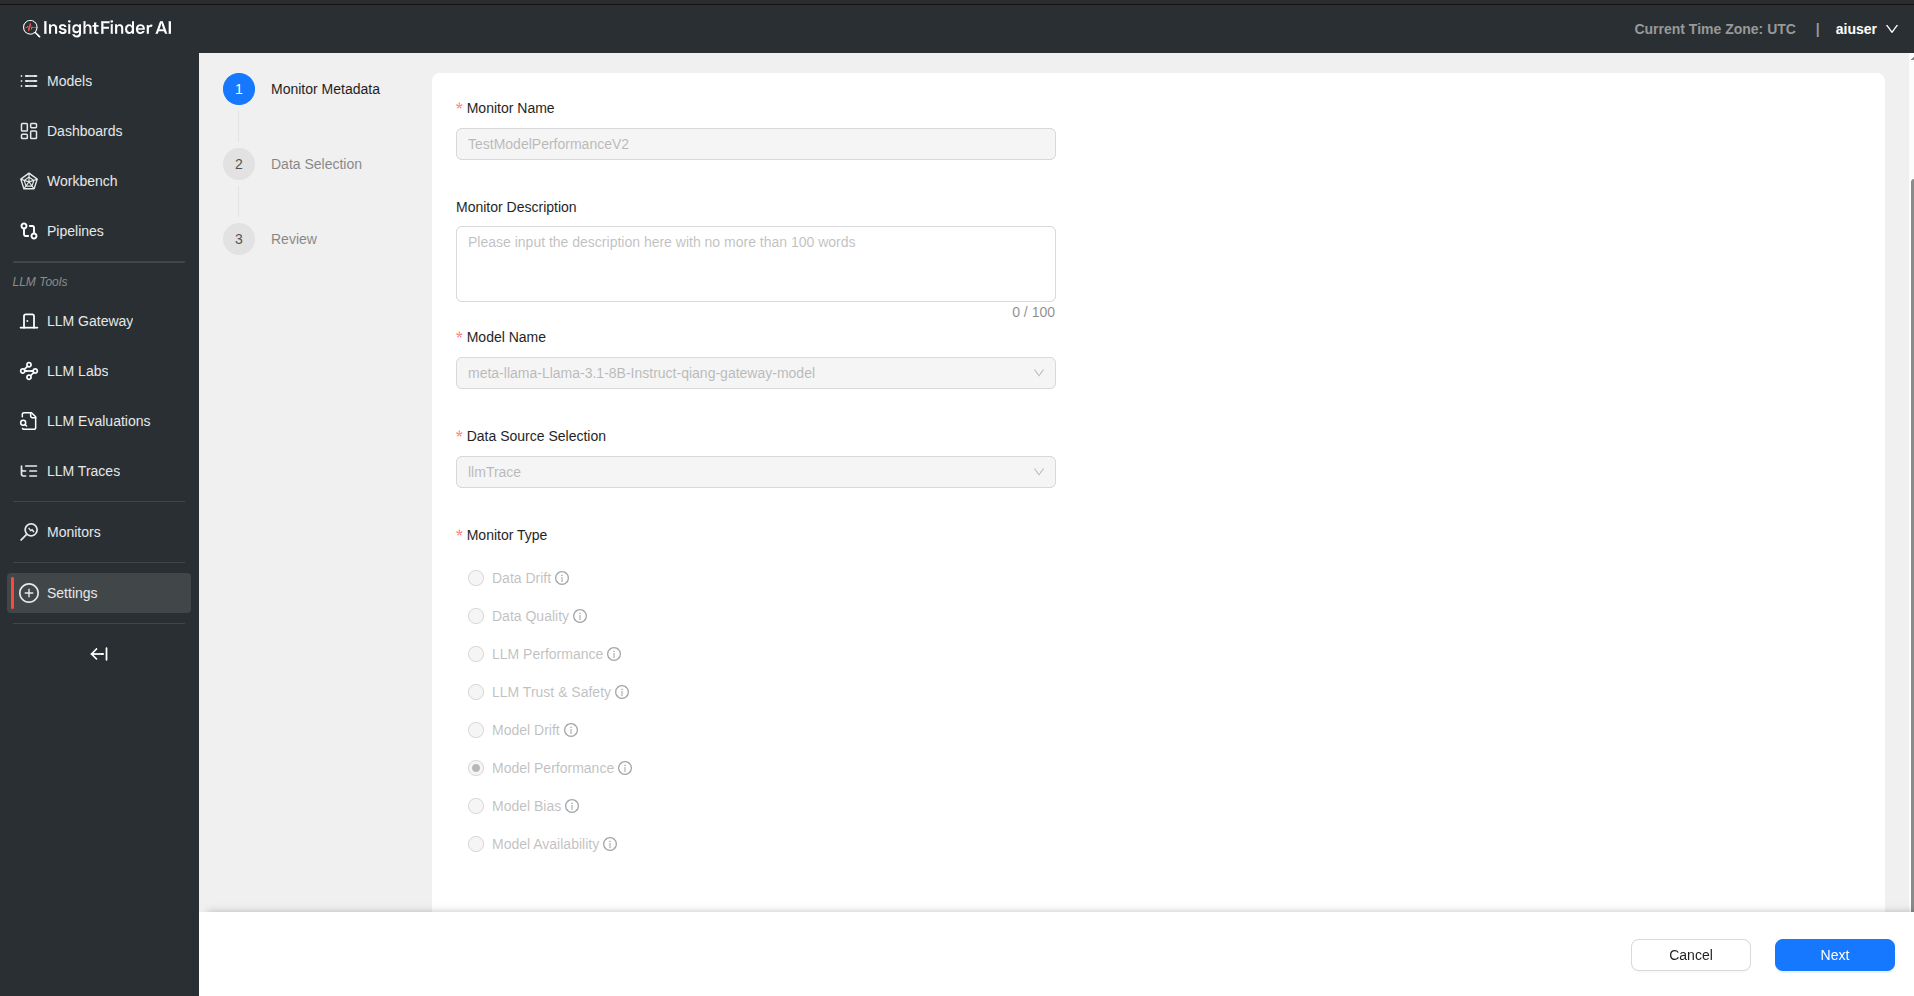
Monitor Name – Provide a descriptive name for your model performance monitor
Monitor Description – Add detailed description explaining performance aspects being monitored
Model Name – Select the model for performance monitoring
Data Source Selection – Choose the data source containing performance metrics
Monitor Type – Select “Model Performance” from the monitor type
Step 2: Data Selection Configuration
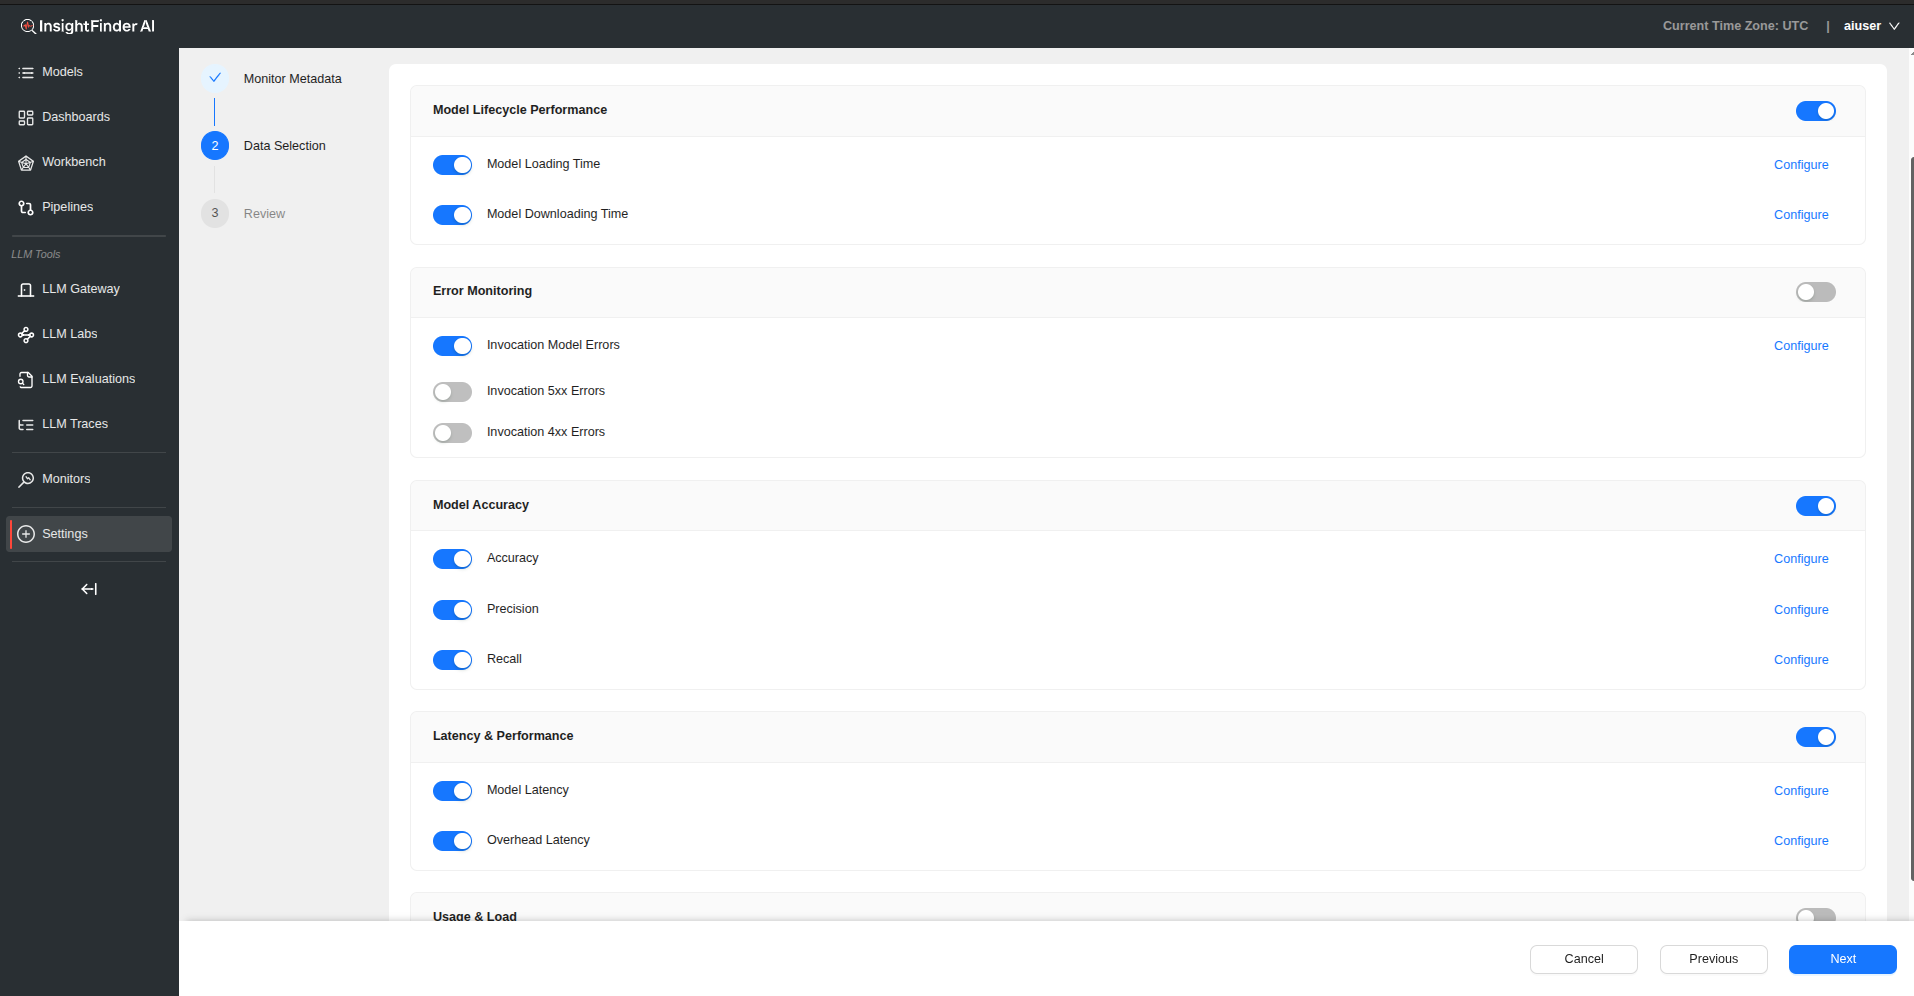
Performance Categories
1. Model Lifecycle Performance
Subtypes:
- Model Loading Time: Time required to load model into memory
- Model Downloading Time: Time required to download model artifacts
2. Error Monitoring
Subtypes:
- Invocation Model Errors: Tracks errors in model execution
- Invocation 5xx Errors: Monitors server-side error responses
- Invocation 4xx Errors: Tracks client-side error responses
3. Model Accuracy
Subtypes:
- Accuracy: Overall prediction correctness
- Precision: True positive rate measurement
- Recall: Sensitivity measurement
4. Latency & Performance
Subtypes:
- Model Latency: Time taken for model inference
- Overhead Latency: Additional processing time overhead
5. Usage & Load
Subtypes:
- Invocations: Number of model calls and usage patterns
Step 3: Configure Detection Settings
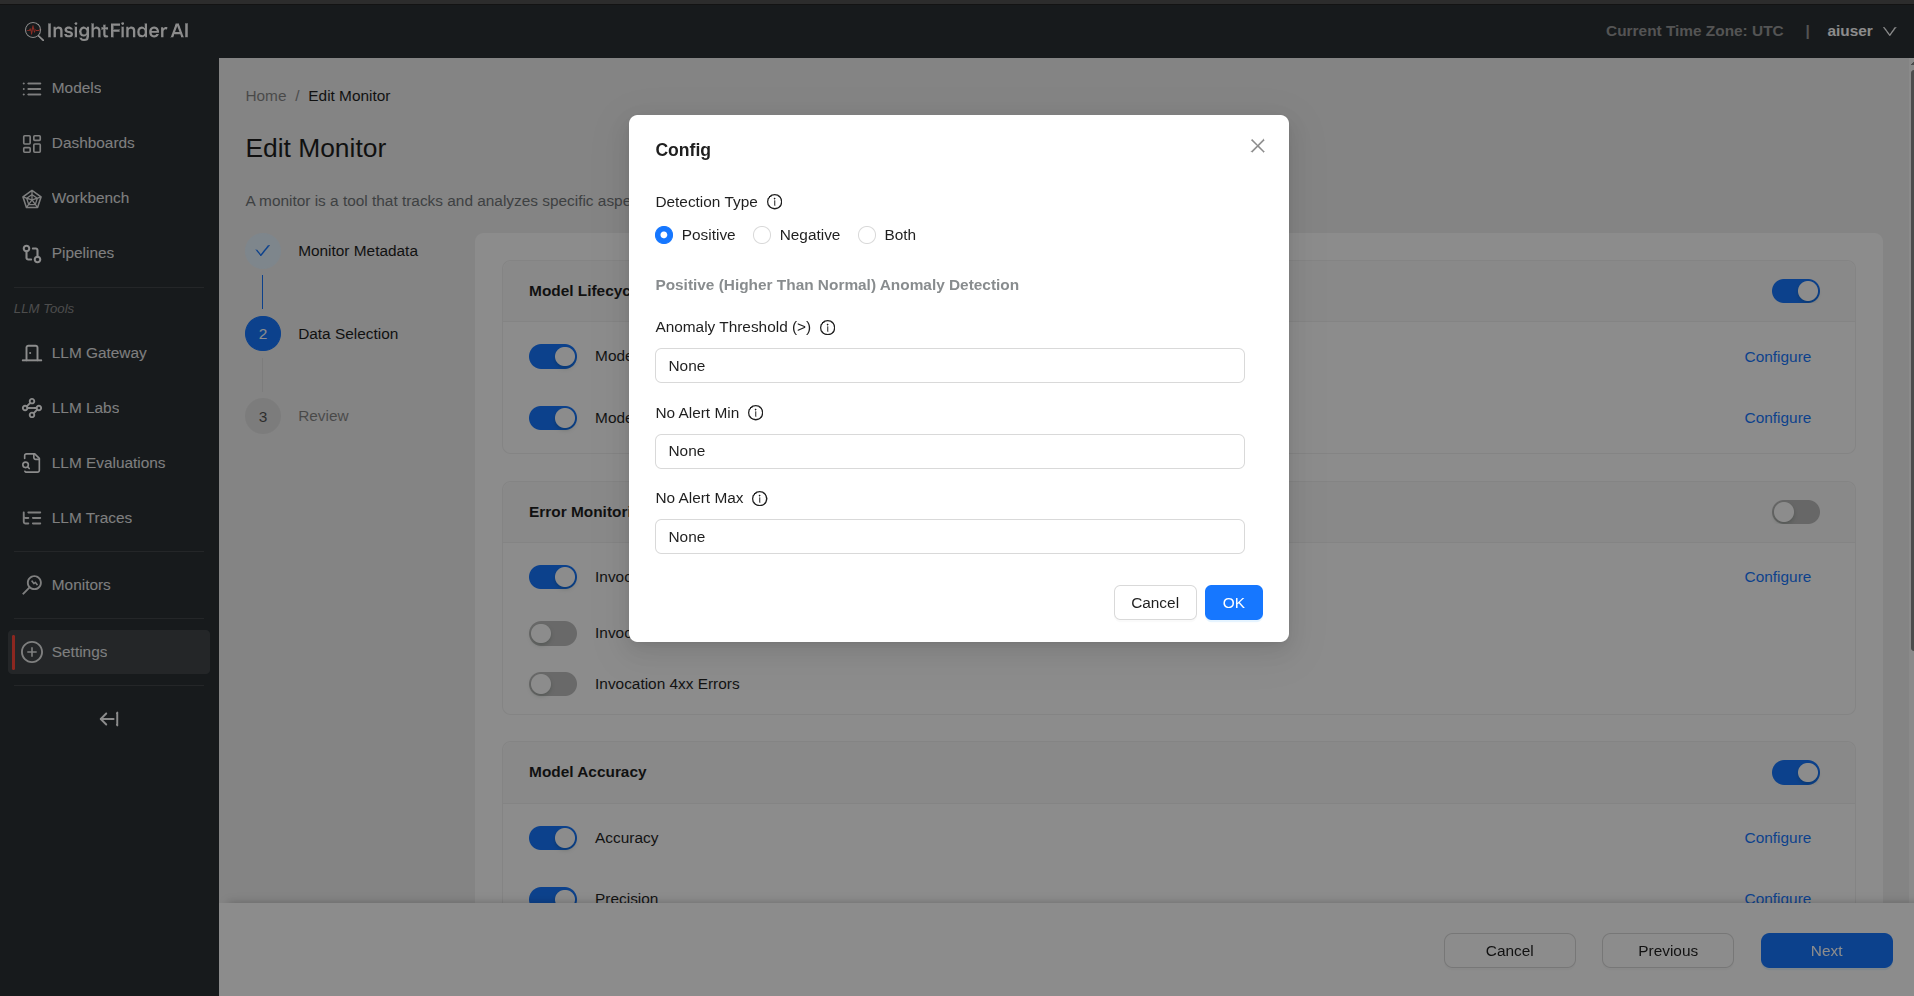
For each subtype, click “Configure” to access detection settings:
Detection Type Options
- Positive: Higher than normal detection
- Negative: Lower than normal detection
- Both: Monitor for both positive and negative anomalies
Threshold Configuration (based on Detection Type selected)
For Positive Detection:
- Anomaly Threshold (>): Generate anomaly when metric value exceeds this threshold
For Negative Detection:
- Anomaly Threshold (<): Generate anomaly when metric value falls below this threshold
- No Alert Min: No anomaly generated when metric value is above this value
- No Alert Max: No anomaly generated when metric value is below this value
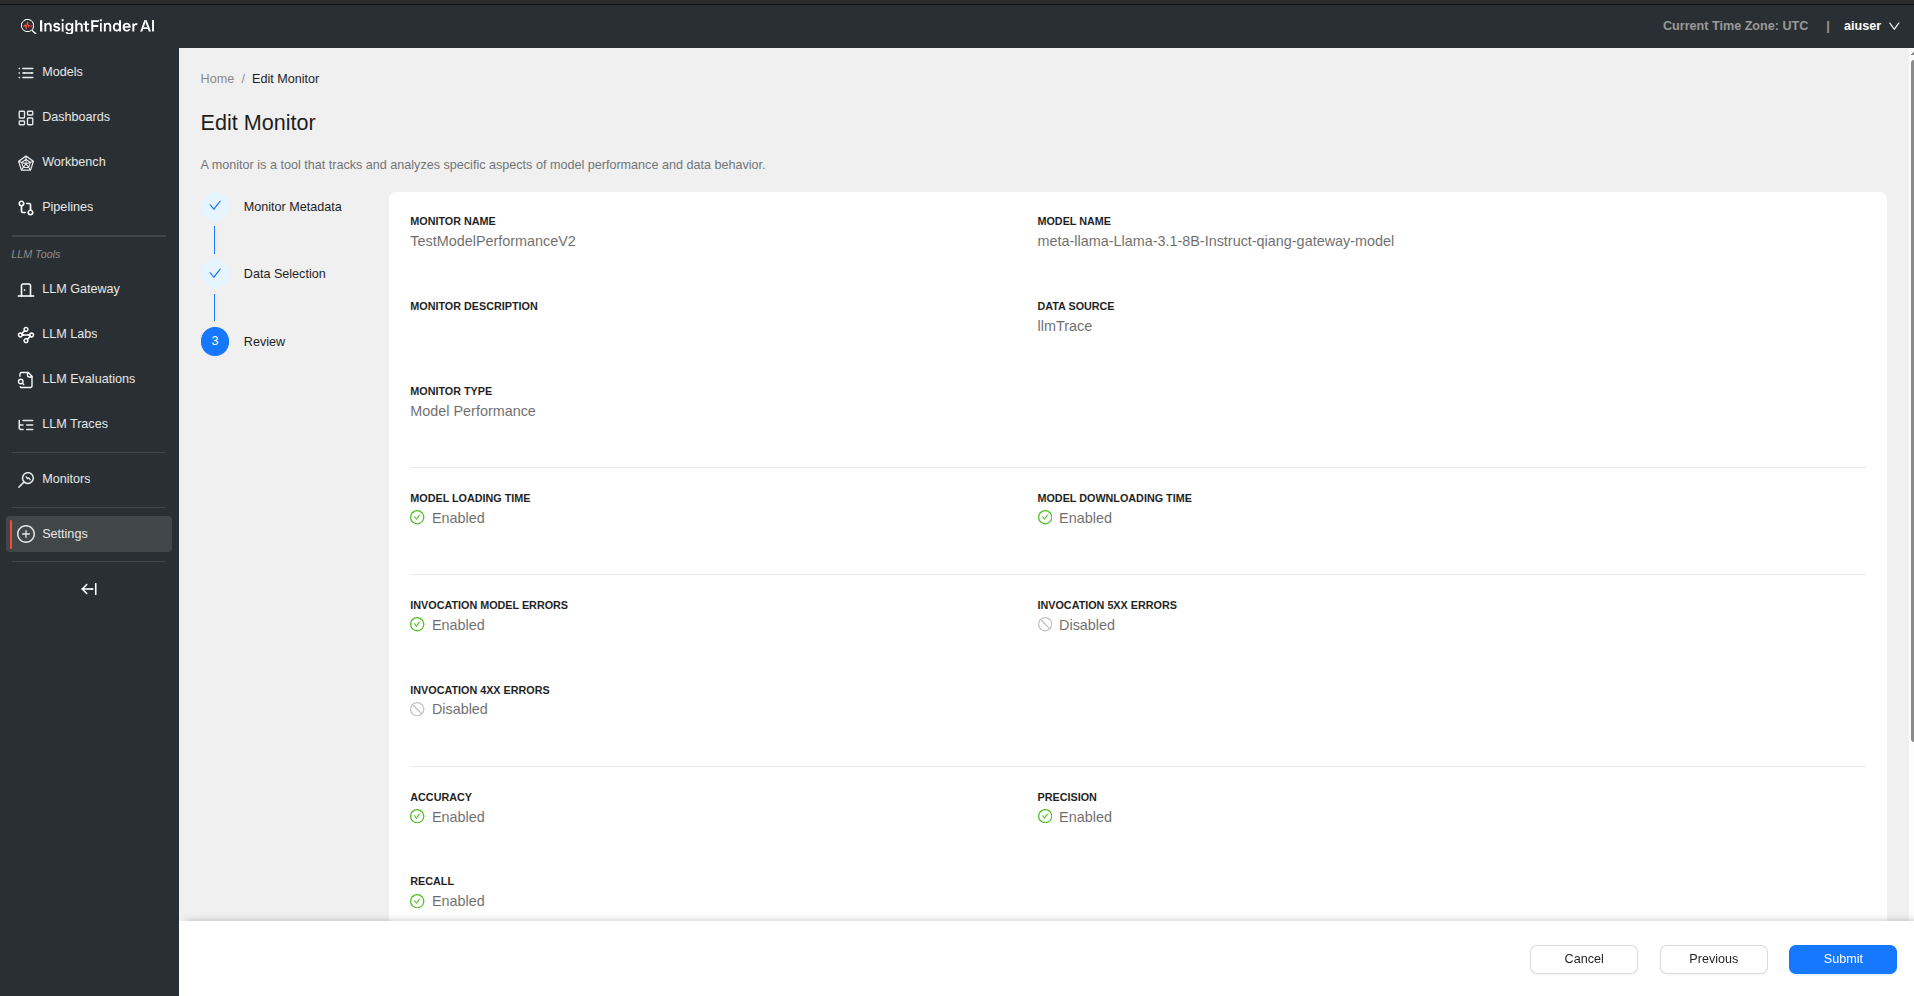
Step 4: Review and Submit
- Click “Next” to review all performance monitoring configurations
- Verify threshold settings for each enabled metric
- Click “Submit” to create the model performance monitor
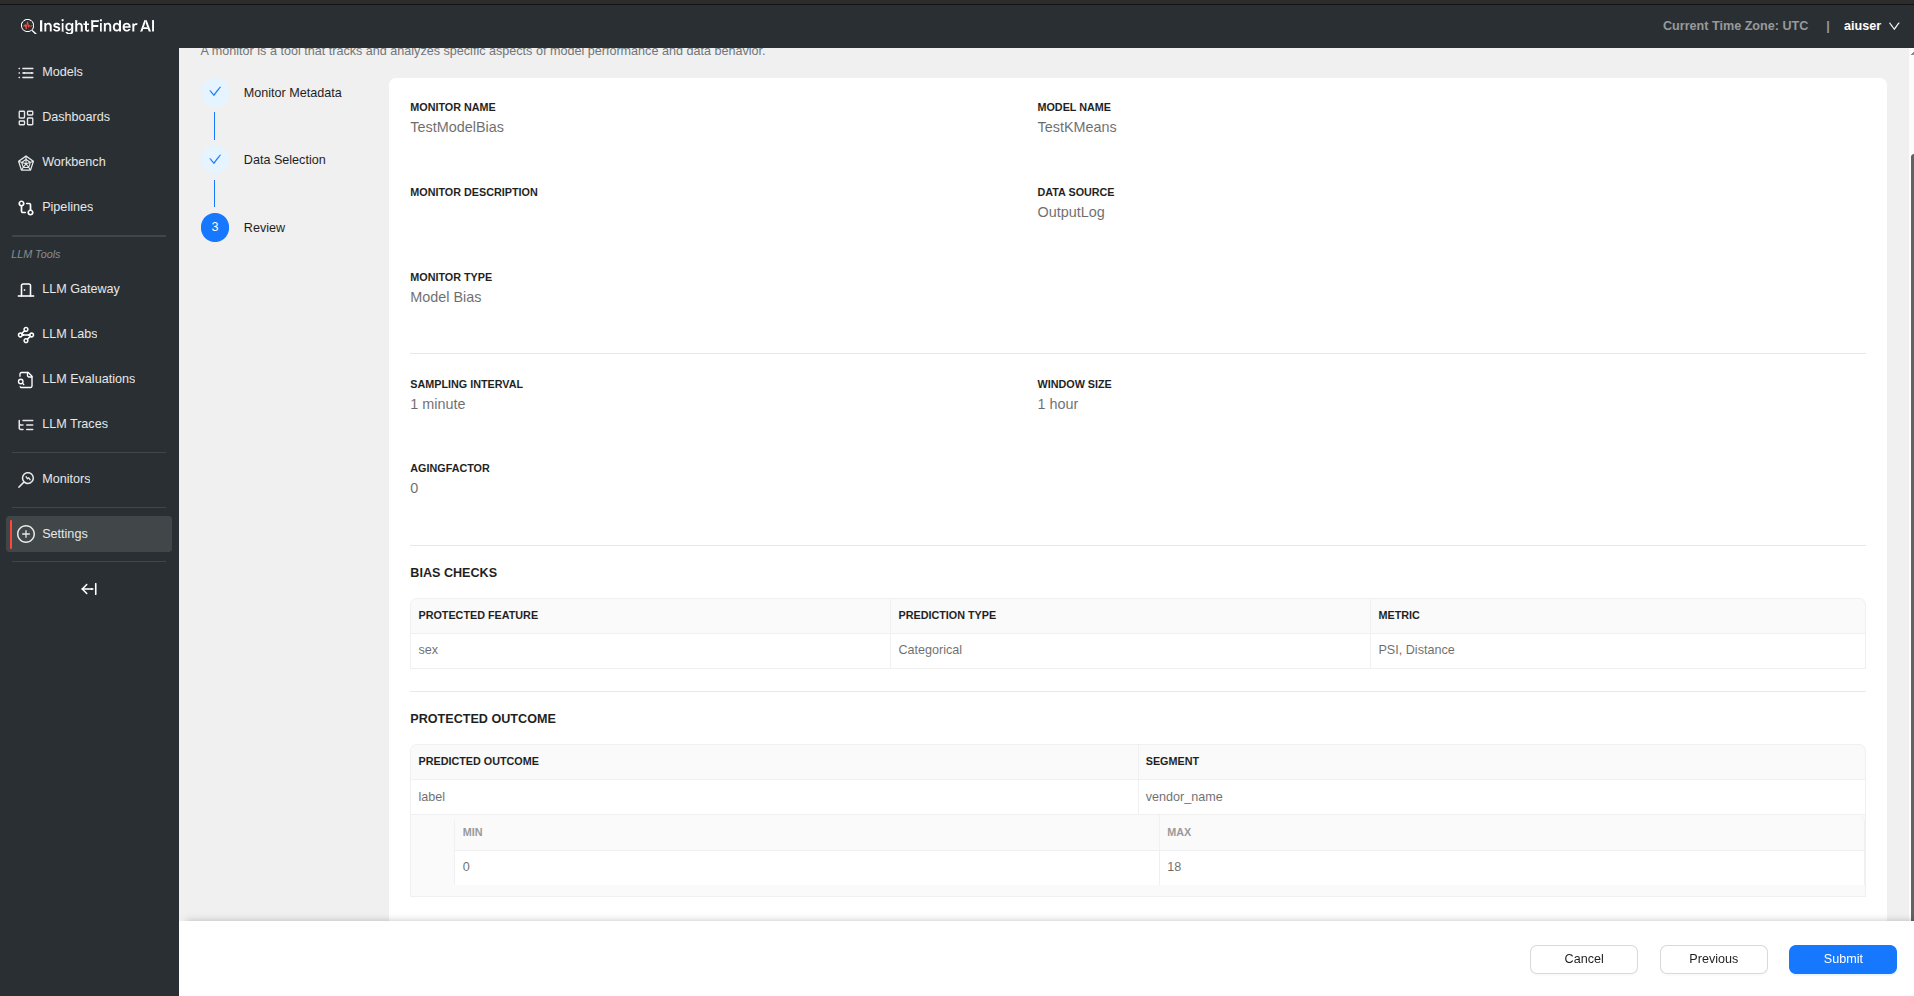
Model Bias Monitor
Overview
Model bias measures how sensitive or responsive a model’s predictions are for one group compared to others, highlighting unequal performance across different demographic or categorical segments.
Configuration Process
Step 1: Basic Monitor Setup

Monitor Name – Provide a descriptive name for your model bias monitor
Monitor Description – Add detailed description explaining bias aspects being monitored
Model Name – Select the model to monitor for bias
Data Source Selection – Choose the data source containing model predictions and protected attributes
Monitor Type – Select “Model Bias” from the monitor type
Step 2: Data Selection Configuration
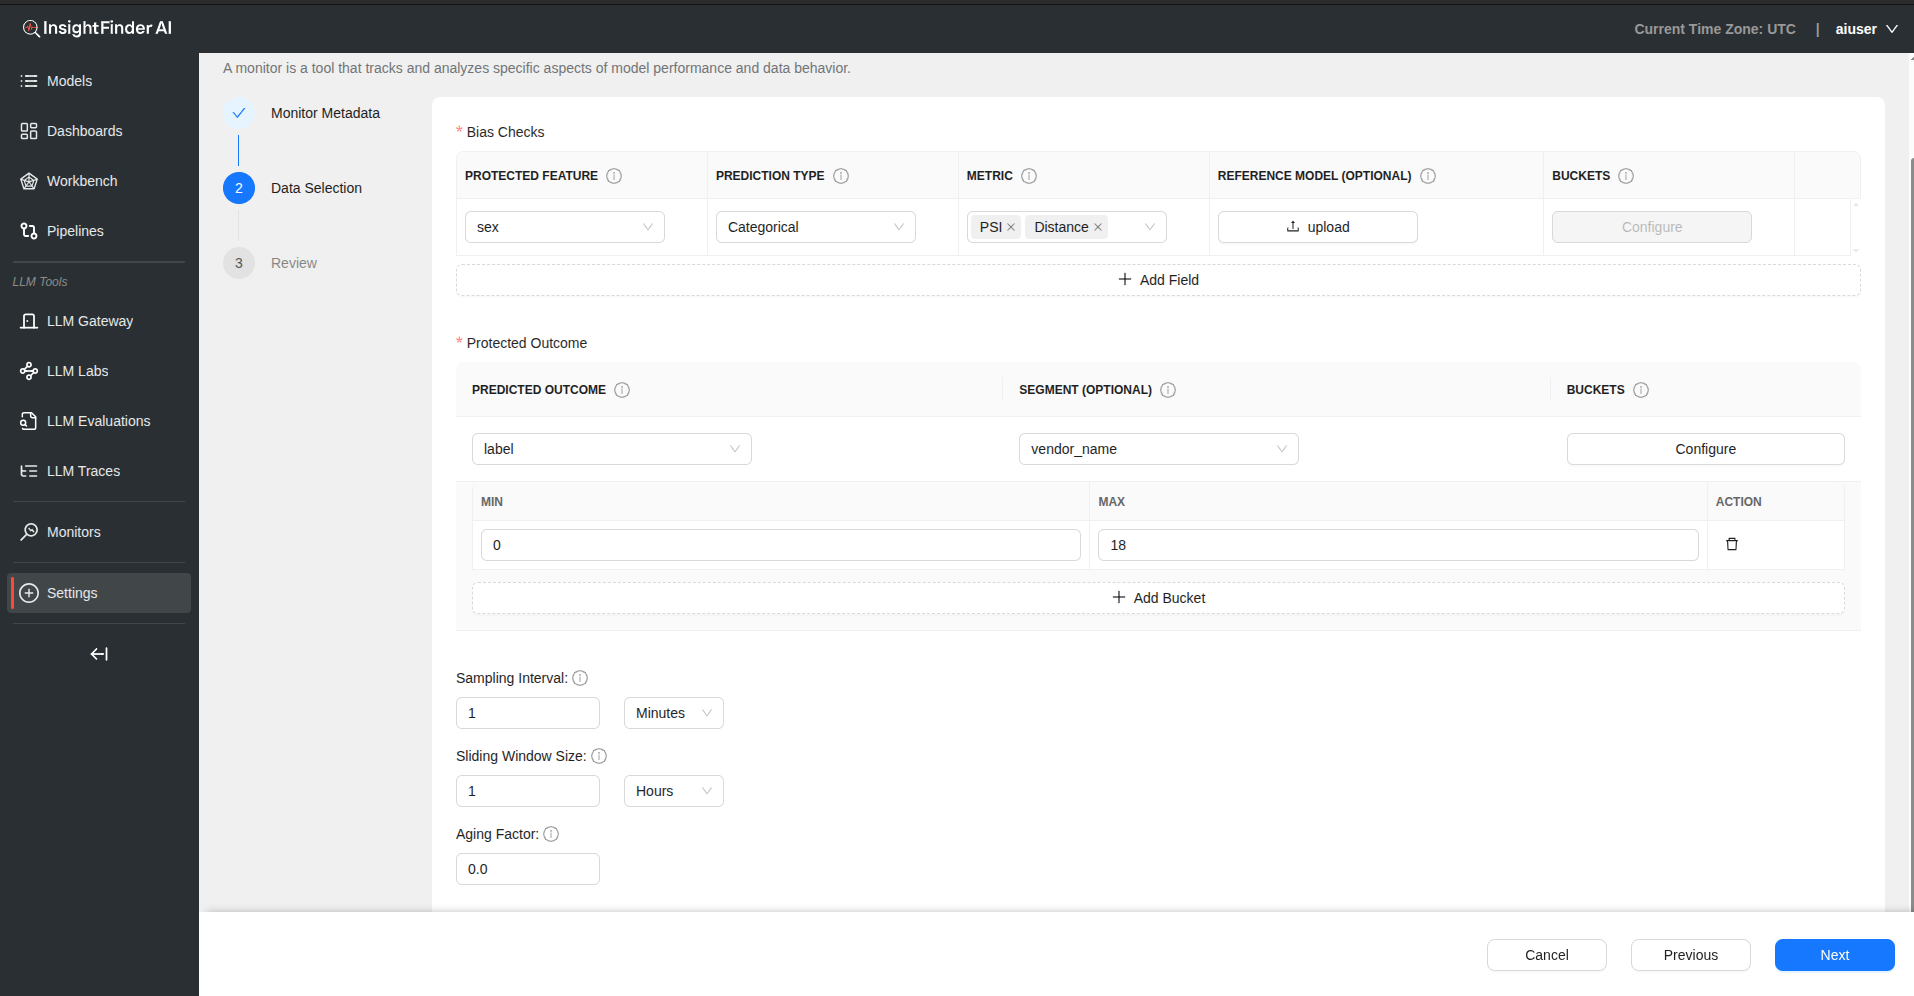
Bias Checks Configuration
Click “Add Field” to configure bias monitoring for specific features.
| Field | Description |
|---|---|
| Protected Feature | The feature being evaluated for potential bias (e.g., gender, age, race) |
| Prediction Type | Categorical (labels like ‘yes’/‘no’) or Numerical (scores/values) |
| Metric | Select appropriate bias metric from dropdown |
| Reference Model (Optional) | Upload baseline model for comparison using upload button |
| Buckets | Configure value ranges for grouping the protected feature |
Bucket Configuration
- Click “Configure” in Buckets column for numerical features
- Define Min and Max values for each bucket
- Add multiple buckets for comprehensive bias analysis
Protected Outcome Section
| Field | Description |
|---|---|
| Predicted Outcome | The predicted label or outcome being analyzed for bias |
| Segment (Optional) | Optional dimension for deeper bias analysis (e.g., region, product line) |
| Buckets | Define value ranges for grouping the protected feature |
Step 3: Monitoring Parameters
Sampling Interval
- Defines the time gap between data points used for monitoring
- Provide value and select time unit (Days, Hours, Minutes)
Sliding Window Size
- Specifies the size of the moving window used for calculating metrics
- Determines temporal scope of bias measurements
Aging Factor
- Determines the weight given to older data when calculating trends
- Balances historical context with recent bias patterns
Step 4: Review and Submit
- Click “Next” to review bias monitoring configuration
- Verify all protected features and metrics are properly configured
- Click “Submit” to create the model bias monitor
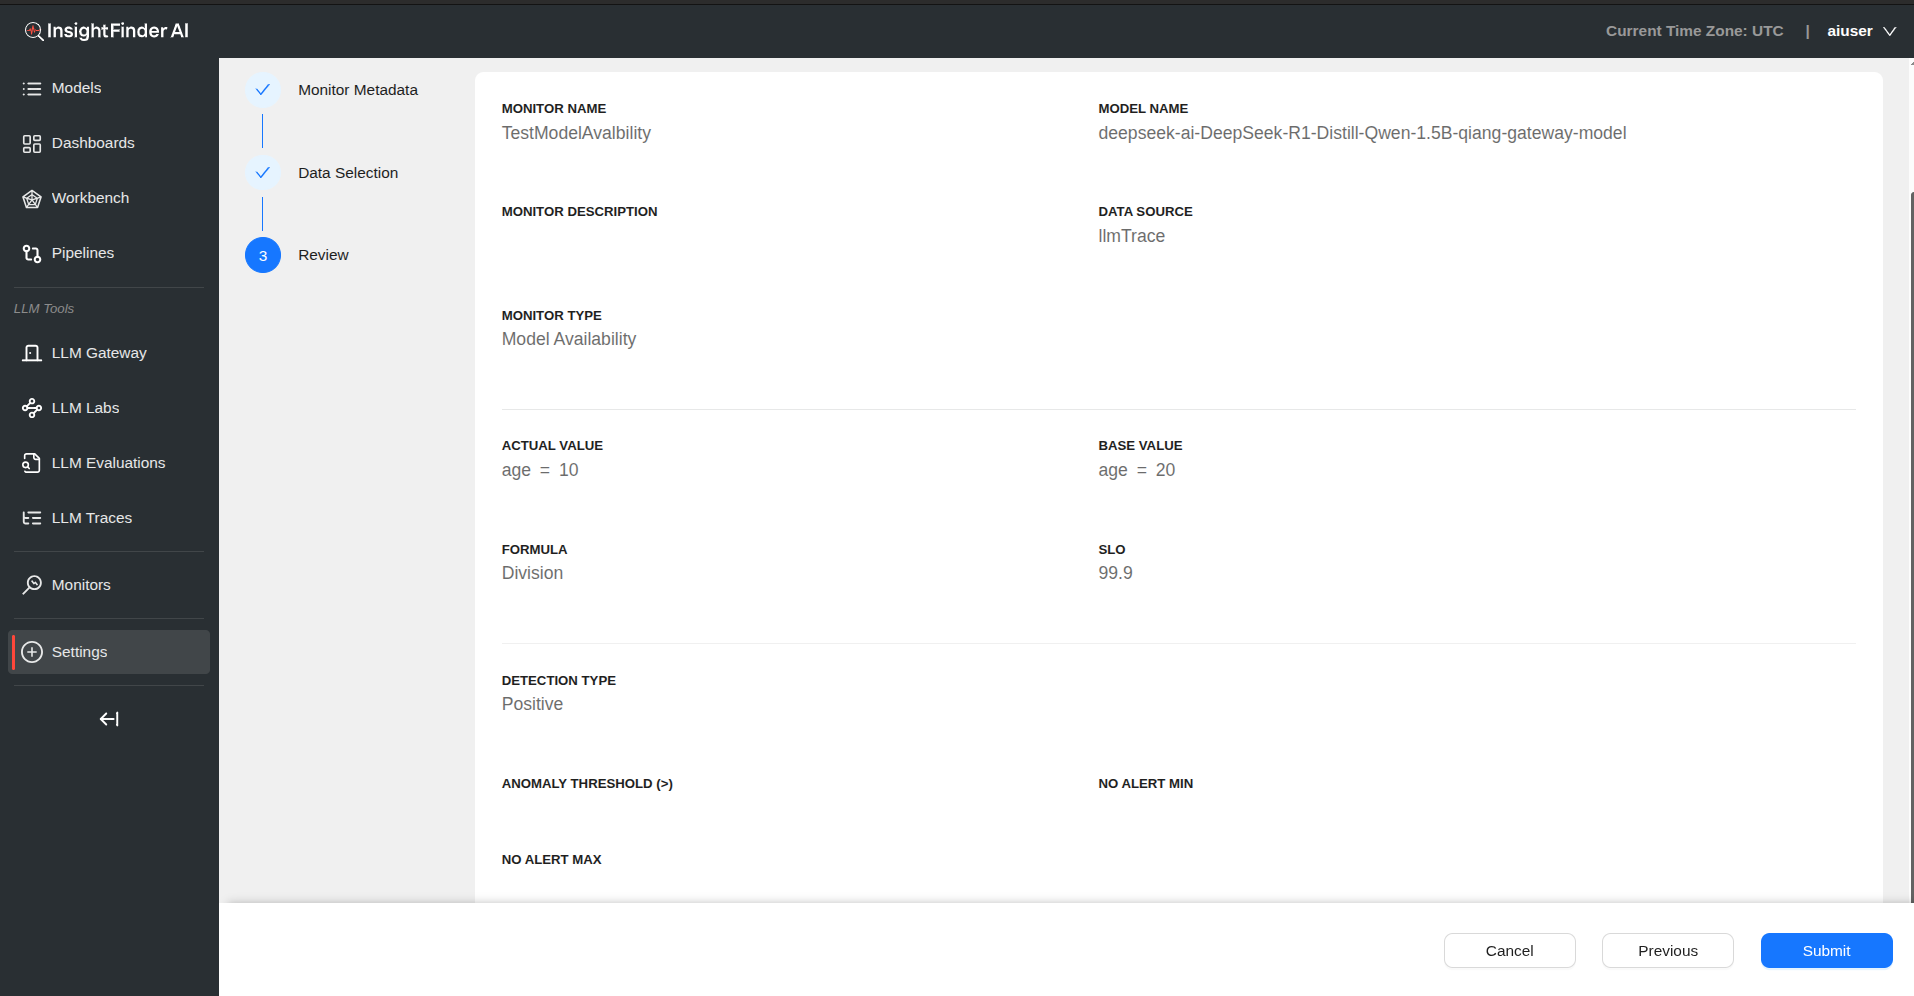
Model Availability Monitor
Overview
Availability represents the proportion of time or number of operations during which a system, service, or resource is functioning correctly and accessible when needed.
Configuration Process
Step 1: Basic Monitor Setup

Monitor Name – Provide a descriptive name for your model availability monitor
Monitor Description – Add detailed description explaining availability aspects being monitored
Model Name – Select the model/service to monitor for availability
Data Source Selection – Choose the data source containing availability metrics
Monitor Type – Select “Model Availability” from the monitor type
Step 2: Data Selection Configuration
Actual Value Configuration
- Field Selection: Select value from dropdown (data from source)
- Value Definition: Provide specific value in text box
Base Value Configuration (All Requests)
- Field Selection: Select reference value from dropdown (data from source)
- Value Definition: Provide base value in text box
Formula
- The logic used to compare actual value against base value
SLO (Service Level Objective)
- Define availability target as percentage
- Example: 99.9% for high availability services
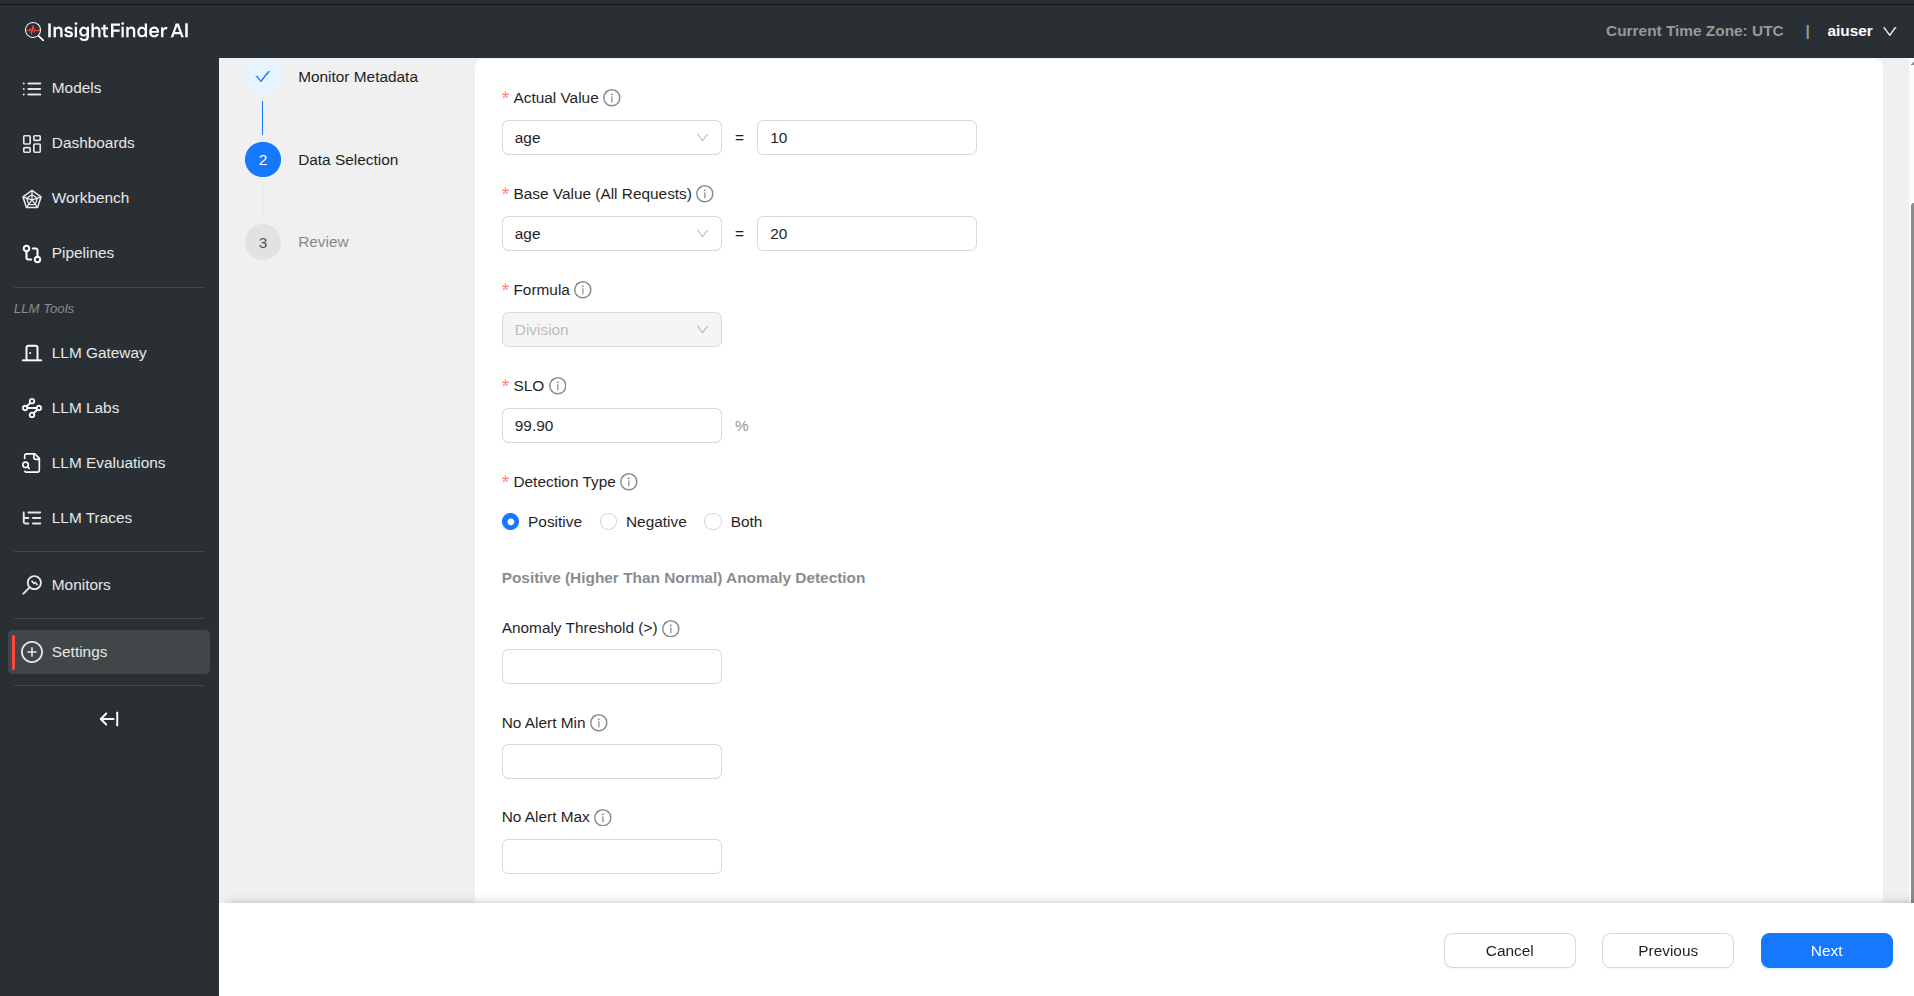
Step 3: Detection Configuration
Detection Type Options
- Positive: Higher than normal detection
- Negative: Lower than normal detection
- Both: Monitor for both positive and negative anomalies
- Threshold Configuration (based on Detection Type selected)
For Positive Detection:
- Anomaly Threshold (>): Generate anomaly when availability exceeds this threshold
For Negative Detection:
- Anomaly Threshold (<): Generate anomaly when availability falls below this threshold
- No Alert Min: No anomaly generated when availability is above this value
- No Alert Max: No anomaly generated when availability is below this value
Step 4: Review and Submit
- Click “Next” to review availability monitoring configuration
- Verify SLO targets and threshold settings
- Click “Submit” to create the model availability monitor
Best Practices
Monitor Selection
- Start with Essentials: Begin with monitors most critical to your use case
- Layered Approach: Implement multiple monitor types for comprehensive coverage
- Resource Consideration: Balance monitoring depth with computational resources
Configuration Guidelines
- Meaningful Names: Use descriptive names that clearly indicate the monitor’s purpose
- Appropriate Thresholds: Set thresholds based on historical data and business requirements
- Regular Reviews: Periodically review and adjust monitor configurations
Data Source Management
- Quality Sources: Ensure data sources are reliable and representative
- Consistent Schema: Maintain consistent data schemas across monitoring periods
- Sufficient Volume: Ensure adequate data volume for meaningful statistical analysis
Alerting Strategy
- Prioritization: Configure different alert levels based on severity
- Noise Reduction: Fine-tune thresholds to minimize false positives
- Response Plans: Establish clear response procedures for different alert types
Performance Optimization
- Sampling Strategy: Use appropriate sampling intervals for your use case
- Window Sizing: Balance detection sensitivity with computational efficiency
- Historical Context: Leverage aging factors to balance recent vs. historical data
Maintenance and Updates
- Regular Audits: Conduct periodic reviews of monitor effectiveness
- Threshold Tuning: Adjust detection thresholds based on operational learnings
- Documentation: Maintain clear documentation of monitor configurations and rationale
This comprehensive monitor documentation provides detailed guidance for implementing and managing all available monitor types in InsightFinder AI WatchTower. Each monitor type addresses specific aspects of AI/ML system observability, ensuring robust monitoring coverage across your entire AI infrastructure.
From the Blog


Explore InsightFinder AI
