Grafana, the open platform engineers trust to visualize metrics, logs, and traces across distributed systems, has become a go-to option for modern observability teams. Grafana AI now adds advanced pattern recognition and automated summarization to your observability data. One question still remains: what actually caused the incident you’re seeing?
InsightFinder bridges that gap with causal inference and root-cause traceability. Now you can use both: by integrating Grafana with InsightFinder AI. Take those world class dashboards and monitors a step further by layering proactive root-cause analysis on top.
This post shows you how.
Using correlation to remediate issues in production
In complex environments, Grafana dashboards can surface vast amounts of correlated activity — simultaneous spikes, latency shifts, and error bursts that appear related, but may or may not be in reality. When issues occur, that means engineers often end up investigating multiple threads, with many turning out to be false positives or downstream side effects.
The problem isn’t visibility; that’s where Grafana shines. When distributed systems fail, it’s hard to know which of the potentially hundreds or thousands of detected issues triggered the failure, and which are just noise. Grafana AI accelerates that process with features like Sift, and Incident Auto-Summaries to correlate signals and point toward likely candidates.
The challenge is causal certainty, or knowing not just where to look but also why the issue occurred to begin with. Without that clarity, teams waste time analyzing the wrong metrics, escalating to multiple groups, and manually deducing root causes that could have been discovered automatically.
Why use Grafana along with InsightFinder?
InsightFinder’s integration with Grafana transforms raw observability data into root cause analysis. InsightFinder uses patented unsupervised behavior learning techniques and temporal dependency modeling to infer causal relationships between anomalies, in any data set, without the need to label your data or define thresholds.
In other words, InsightFinder learns the relationships between components, services, and workloads; not from static configuration, but by observing behavior in real time and adapting the model to suit your particular environment.
Causal Inference vs. Correlation
Traditional AIOps platforms ingest your telemetry signals (logs, metrics, traces, etc) and group outliers together in order to reduce noise. Performance issues are grouped and examined by algorithms designed to correlate the various signals.
InsightFinder goes further: it identifies whether an anomaly is caused by or co-occurring with other events in your system. It models lag times, dependency direction, and impact propagation to build causal chains that reveal how an upstream code change, API slowdown, or configuration shift cascades through the stack.
Engineers can view not just concurrent spikes, but verified root-cause paths complete with confidence scores that reflect the system’s learned understanding of its own behavior.
InsightFinder’s causal reasoning hypercharges Grafana dashboards into showing not just what is (or could be) happening, but exactly where, why, and—most importantly—how to fix it.
Root Cause Clarity: From Symptom to Explanation
Grafana, like most observability tools, visualizes the symptoms of performance issues: a service’s latency spike, a drop in throughput, or a rise in error rate, etc. InsightFinder takes it a step further by supplying an explanation of the issue by connecting that incident to upstream causes. Each alert in Grafana becomes traceable through a chain of related telemetry, configuration changes, and dependency impacts.
This is not heuristic guessing, it’s evidence-based attribution supported by timestamps, dependencies, and learned propagation patterns at the core of what makes InsightFinder unique.
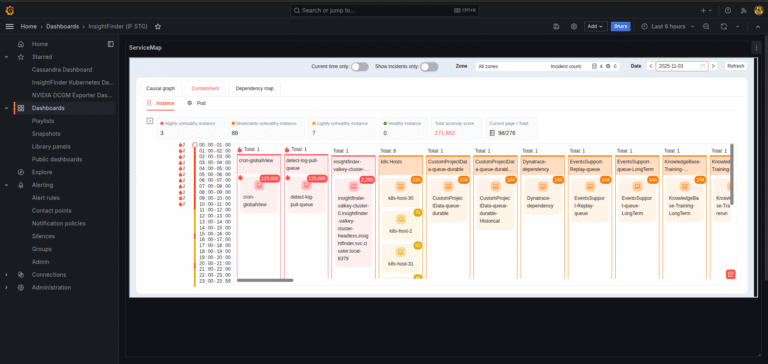
Engineers can replay the causal chain within Grafana’s Service Map, validating each step from symptom to verified cause. Through these visualizations, InsightFinder brings full-stack behavior insights directly into Grafana, helping teams navigate from anomaly detection to root-cause validation within a single interface.
Grafana + InsightFinder = two great tools that are better together.
Integration Depth: InsightFinder + Grafana Workflow
InsightFinder integrates directly with Grafana’s data sources and visualization layers to deliver a unified workflow for detection, investigation, and validation.
- Data Ingestion: Grafana feeds metrics, logs, and traces from Prometheus, Loki, and Tempo into InsightFinder’s inference engine.
- Causal Analysis: InsightFinder identifies temporal and logical dependencies between anomalies to isolate true causal relationships.
- Composite Incident Generation: Related alerts are automatically merged and enriched with contextual evidence — including service dependencies and historical baselines.
- Visualization: These insights return to Grafana as Causal Graphs, Service Maps and Heat Maps, embedding causal and predictive intelligence into familiar dashboards.
- Action: Predicted incidents can trigger ServiceNow or Jira ticket creation, ensuring that verified root causes, not just raw alerts, initiate response workflows.
For teams using Grafana AI, InsightFinder extends its capabilities by providing validated causal context to complement Grafana’s anomaly summaries. The result is faster triage, higher confidence, and measurable MTTR reduction.
How this helps customers
Several InsightFinder customers report solid tangible improvements using this joint approach, and the results appear across industries and domains. For example:
- Telecommunications: InsightFinder correctly predicted service degradations up to three hours in advance by linking missing change records with downstream performance anomalies in a critical streaming service.
- Aerospace: During a proof-of-concept with a large aerospace firm, InsightFinder correlated telemetry anomalies across flight data processing and infrastructure metrics, to correctly and quickly isolate root causes automatically, while their existing tools left them flying blind.
- Financial Services: In high-frequency critical financial transaction systems, InsightFinder correctly and quickly identified database query stalls that preceded SLA breaches by 45 minutes, giving the on-call engineering team a precious headstart to remediate the problems before severe customer impacts occurred.
Note: Statistics reference internal deployment data
Across these environments, Grafana provided the visualization layer engineers already knew; InsightFinder supplied the predictive, causally validated intelligence beneath it.
Active Learning for Dynamic Operations
InsightFinder continuously retrains the data models responsible for these outcomes based on live feedback and resolved incidents, enabling ongoing segmentation of active systems, workloads, and user groups. The key here is simple: without manual retraining, the models learn how your systems actually work.
As Grafana streams fresh visualization data, InsightFinder updates its understanding of which components are most critical or volatile, dynamically adjusting anomaly thresholds and dependency graphs without you needing to intervene or guide the process.
This means Grafana dashboards remain adaptive, reflecting the organization’s current operational state rather than static baselines. The system becomes smarter with every incident closed, reinforcing a continuous feedback loop between detection, analysis, and resolution.
The Future of Grafana AI Monitoring
Grafana AI helps teams see anomalies faster and reduces the sources of likely issues. InsightFinder helps those same teams understand why the issues happen and how to fix them. Together, Grafana and InsightFinder turn observability into causal intelligence: a state where systems not only report what went wrong, but show exactly how it started and what to fix first.
For complex, regulated, or distributed enterprises, this partnership delivers more than insight, it delivers evidence-based reliability. Grafana remains the visibility layer; InsightFinder becomes the reasoning engine behind it.
Learn more about integrating InsightFinder with Grafana AI Monitoring
