Welcome to InsightFinder AI Observability Docs!
Categories
Workbench
Workbench is a one stop location to view all the monitoring data and analysis results from InsightFinder AI WatchTower. Using the Workbench, users can gain insight into how the models are performing over time, monitor the models for drifts and bias, and identify and analyze any data quality issues that might occur.
Monitors offered by InsightFinder:
Model Drift
Model drift refers to the phenomenon where the performance of a model degrades over time due to changes in the underlying data patterns. In today’s fast-paced digital world, AI, LLM and machine learning models need to keep up with ever-changing data and user behaviors. Model drift happens when the data the model sees in production starts to differ from the data it was trained on – causing predictions to become less accurate over time.
Why Monitor Model Drift?
Unchecked model drift can lead to missed opportunities, poor customer experiences, and costly mistakes, while making bad predictions that could negatively impact the business. By proactively monitoring for drift, users ensure their models stay sharp, relevant, and trustworthy—delivering the insights and automation users rely on.
Monitoring model drifts is crucial because:
- Maintaining Accuracy: Drift can cause models to make less accurate predictions, leading to poor business outcomes or user experiences.
- Early Detection: By monitoring drift, teams can detect issues early and retrain or update models before performance drops significantly.
- Compliance and Trust: In regulated industries, monitoring ensures models remain fair, unbiased, and compliant with standards.
- Cost Efficiency: Proactively addressing drift reduces the risk of costly errors or failures in production systems.
With InsightFinder, users can automatically monitor for model drift and take action before it affects businesses.
Data Drift
Data drift occurs when the statistical properties of the input data change over time, even if the relationship between inputs and outputs remains the same. In dynamic business environments, data sources, user behavior, and external factors can all shift, causing the data the models receive in production to differ from what they were originally trained on. This can silently erode model performance and reliability.
Why Monitor Data Drift?
Ignoring data drift can result in declining model accuracy, unexpected outcomes, and missed business opportunities. By continuously monitoring for data drift, users can quickly identify when the input data is changing, allowing them to take corrective action before it impacts the results. Monitoring data drift is essential because:
- Preserving Model Performance: Early detection of data drift helps maintain high prediction accuracy and consistent outcomes.
- Proactive Issue Resolution: Identifying drift early enables teams to retrain or adjust models before performance issues arise.
- Regulatory Compliance: Monitoring ensures the models continue to operate within required standards and avoid unintended bias.
- Business Continuity: Staying ahead of data changes reduces operational risk and supports better decision-making.
With InsightFinder, users can automatically detect and respond to data drift, ensuring your AI solutions remain robust and effective as the data evolves.
Model Bias
Model bias occurs when a model produces systematically skewed predictions that favor or disadvantage certain groups, segments, or conditions. Bias can creep in through imbalanced training data, proxy variables, shifting demographics, or feedback loops. Left unaddressed, it erodes trust, damages brand reputation, and can create regulatory or ethical exposure.
Why Monitor Model Bias?
Monitoring bias ensures your AI remains fair, transparent, and aligned with business and compliance goals. Continuous bias assessment lets users detect unintended disparities early and remediate before they escalate. Monitoring model bias is essential because:
- Fair Outcomes: Identifies disproportionate errors or outcomes across user groups.
- Regulatory Readiness: Supports compliance with emerging AI governance and industry standards.
- Brand Trust: Demonstrates accountability and ethical stewardship of AI decisions.
- Risk Reduction: Reduces legal, financial, and reputational risk from discriminatory behavior.
- Sustained Performance: Prevents hidden bias from degrading long-term model effectiveness.
With InsightFinder, users can continuously surface, track, and address model bias – keeping the AI equitable, reliable, and defensible.
Data Quality
Robust data quality underpins analytical accuracy, operational reliability, and AI model efficacy. Outliers, duplication, schema drift, referential breaks, and format inconsistencies introduce silent failure modes that cascade through reports, pipelines, and ML workflows. InsightFinder’s Data Quality Monitors profile and evaluate heterogeneous source and target systems to measure freshness, completeness, validity, conformity, uniqueness, and consistency in near real time.
Why Monitor Data Quality?
Ignoring data quality turns trusted insight into guesswork. Proactive monitoring delivers:
- Consistent Trustworthy Decisions: Ensures business dashboards, analytics, and AI models ingest accurate, complete, and current data.
- Faster Incident Isolation: Real‑time alerts on anomalies, missing batches, volume spikes, latency, and schema drift reduce investigation time.
- Unified Governance: Delivers auditable metrics (freshness, completeness, validity, uniqueness) across heterogeneous data estates.
- Cost & Efficiency: Prevents wasted processing on corrupted or duplicate data and reduces rework.
- Resilient Integrations: Protects data pipelines, sync jobs, and API consumers from silent failures.
With InsightFinder, teams gain always‑on visibility into data health across all platforms – ensuring every analytic, operational, and AI initiative is built on a dependable foundation.
LLM Trust & Safety
Large Language Models can inadvertently emit biased, toxic, unsafe, hallucinated, or privacy‑sensitive content – especially under adversarial prompts, prompt‑injection attacks, or data exfiltration attempts. InsightFinder’s LLM Trust & Safety Monitor continuously inspects both inputs (user prompts, system/context injections) and model outputs to detect bias, toxicity, jailbreak patterns, prompt leakage, hallucinations, PII exposure, and malicious intent signatures in real time.
Why Monitor LLM Trust & Safety?
- Risk Mitigation: Flags harmful, non‑compliant, or brand‑damaging responses before delivery.
- Bias & Fairness Control: Identifies disparate or discriminatory language across demographic segments.
- Hallucination Reduction: Correlates claims with retrieval / grounding signals to surface low‑confidence or fabricated content.
- Security & Abuse Defense: Detects prompt injection, jailbreak heuristics, exfiltration probes, and chained attack patterns.
- Privacy Protection: Scrubs or blocks outputs containing PII, secrets, or regulated data artifacts.
- Governance & Audit: Provides structured event logs, severity scoring, remediation tags, and policy traceability for audits.
InsightFinder enables proactive enforcement of safety, ethical, and compliance policies across all LLM use cases – safeguarding end users while preserving reliable AI functionality.
LLM Performance
InsightFinder’s LLM Performance Monitor ingests traces and spans from models to detect increased response times, tail latency spikes, span errors, missing / incomplete responses, and degraded throughput. It normalizes trace attributes (latency, tokens, model, route, status) into time‑series metrics, rendering them in the Model Performance Workbench for rapid comparative analysis across models, versions, and workloads.
Why Monitor LLM Performance?
- Latency & Tail Control: Identifies p95/p99 inflation, queueing, and cold start patterns impacting UX.
- Error & Fault Isolation: Surfaces spans with exceptions, timeouts, cancellations, and incomplete generations.
- Reliability Gaps: Flags missing responses or truncated outputs tied to upstream/downstream components.
- Efficiency & Cost: Tracks token in/out ratios, retries, and wasted compute to optimize spend.
- Capacity Planning: Monitors concurrency, saturation signals, and throughput to right‑size infrastructure.
- Regression Detection: Compares new model or prompt version performance baselines vs historical norms.
- Unified Observability: Correlates performance metrics with safety, quality, and drift monitors for holistic model health.
InsightFinder delivers actionable, metrics‑driven visibility over every LLM interaction – enabling fast triage, optimization, and continuous performance assurance.
Navigation
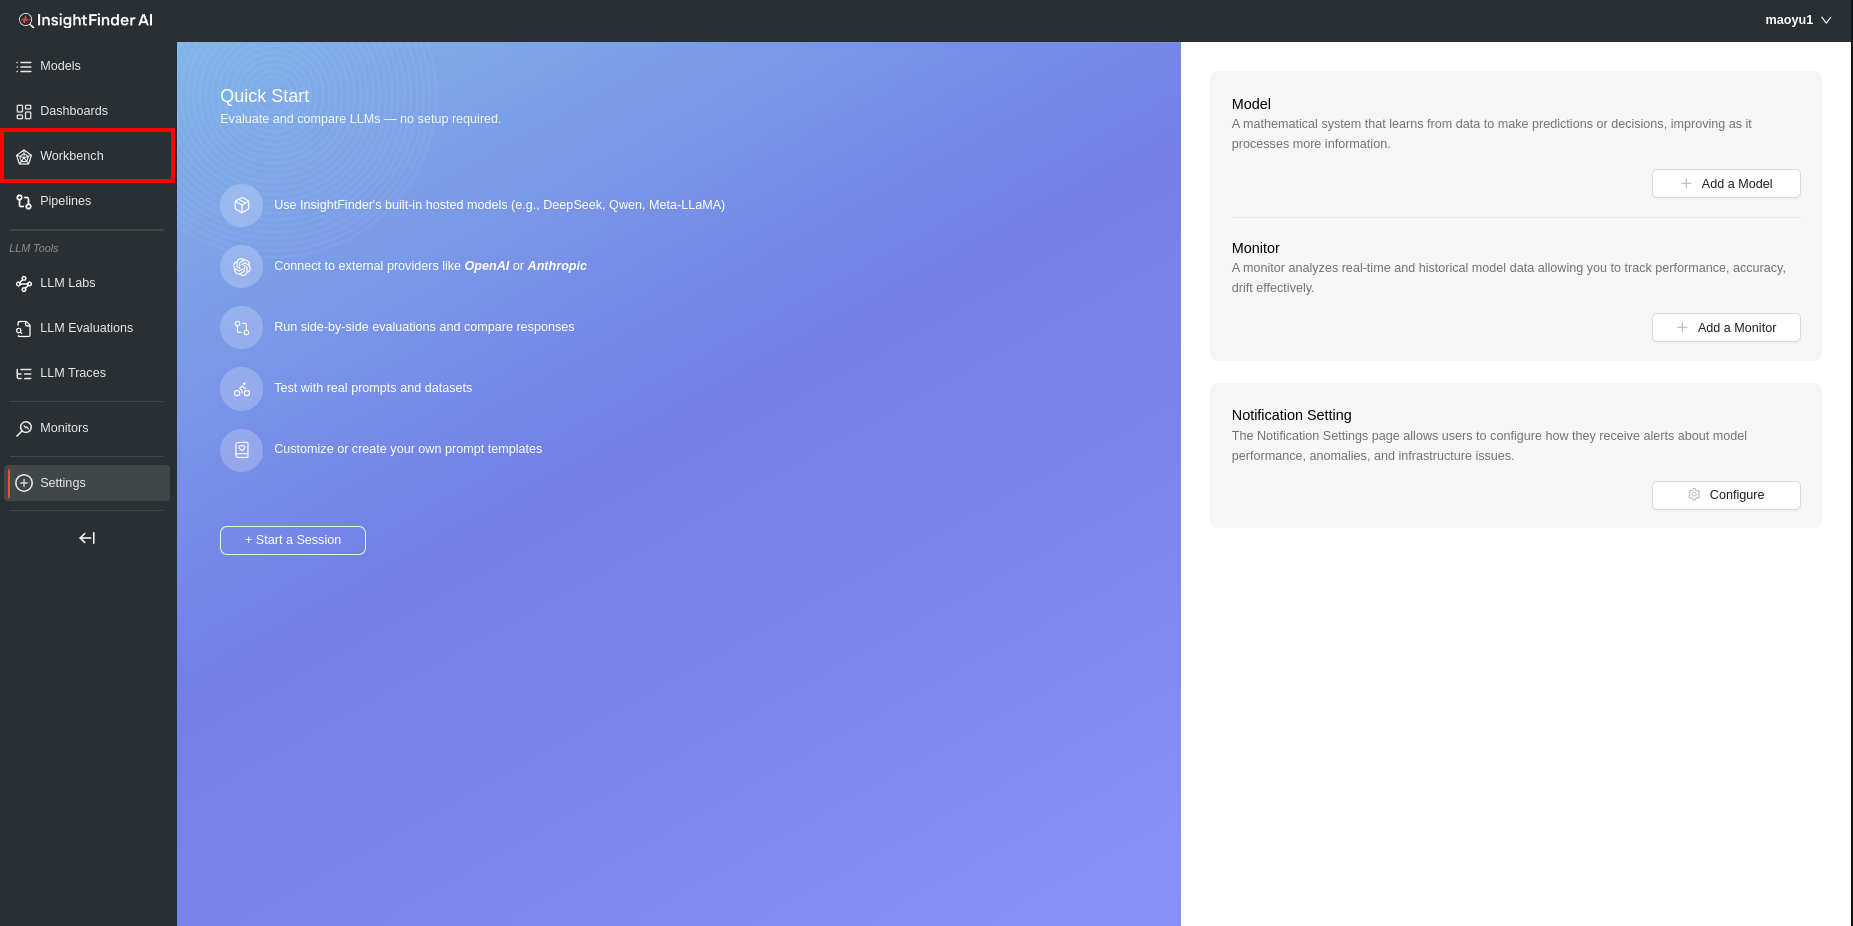
Once logged into InsightFinder AI WatchTower, users can use the side bar menu to navigate to the Workbench.
Workbench Page
Once the model has been set up to receive the necessary data along with setting up the required monitors, the analysis done by the monitors can be seen on the InsightFinder AI WatchTower Workbench Page.
Loading the Data
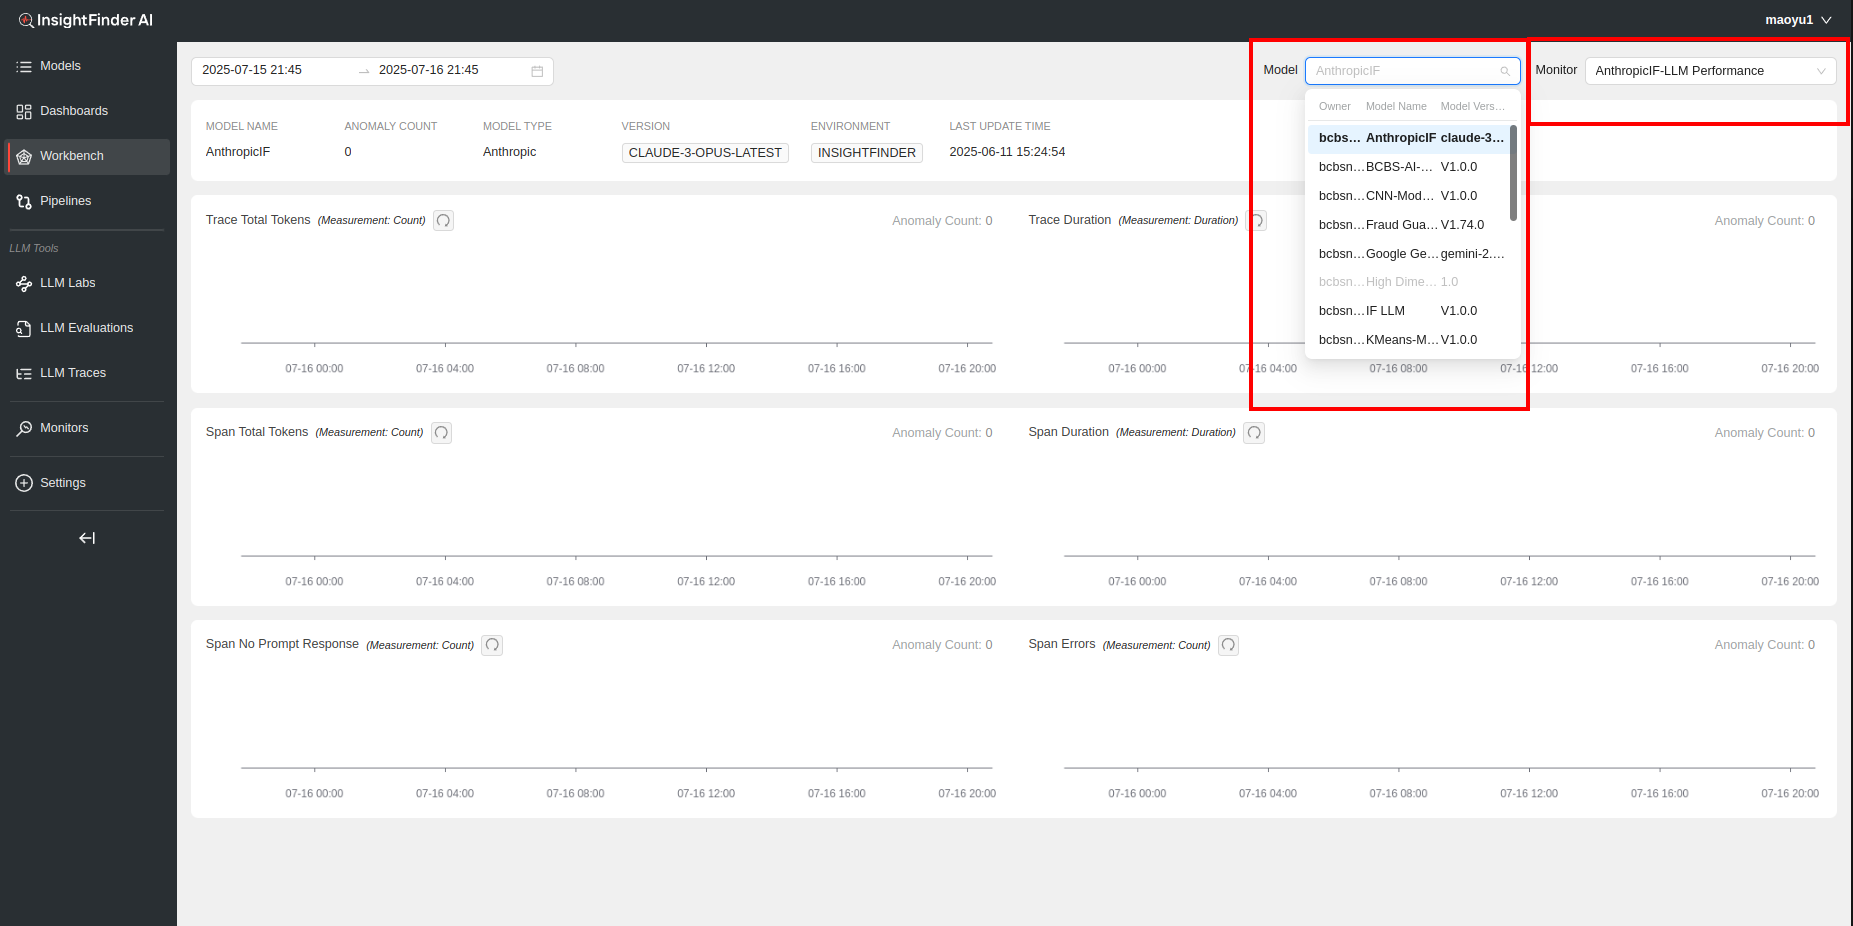
The Model and Monitor can be selected from the drop downs on top right (or can be typed in)
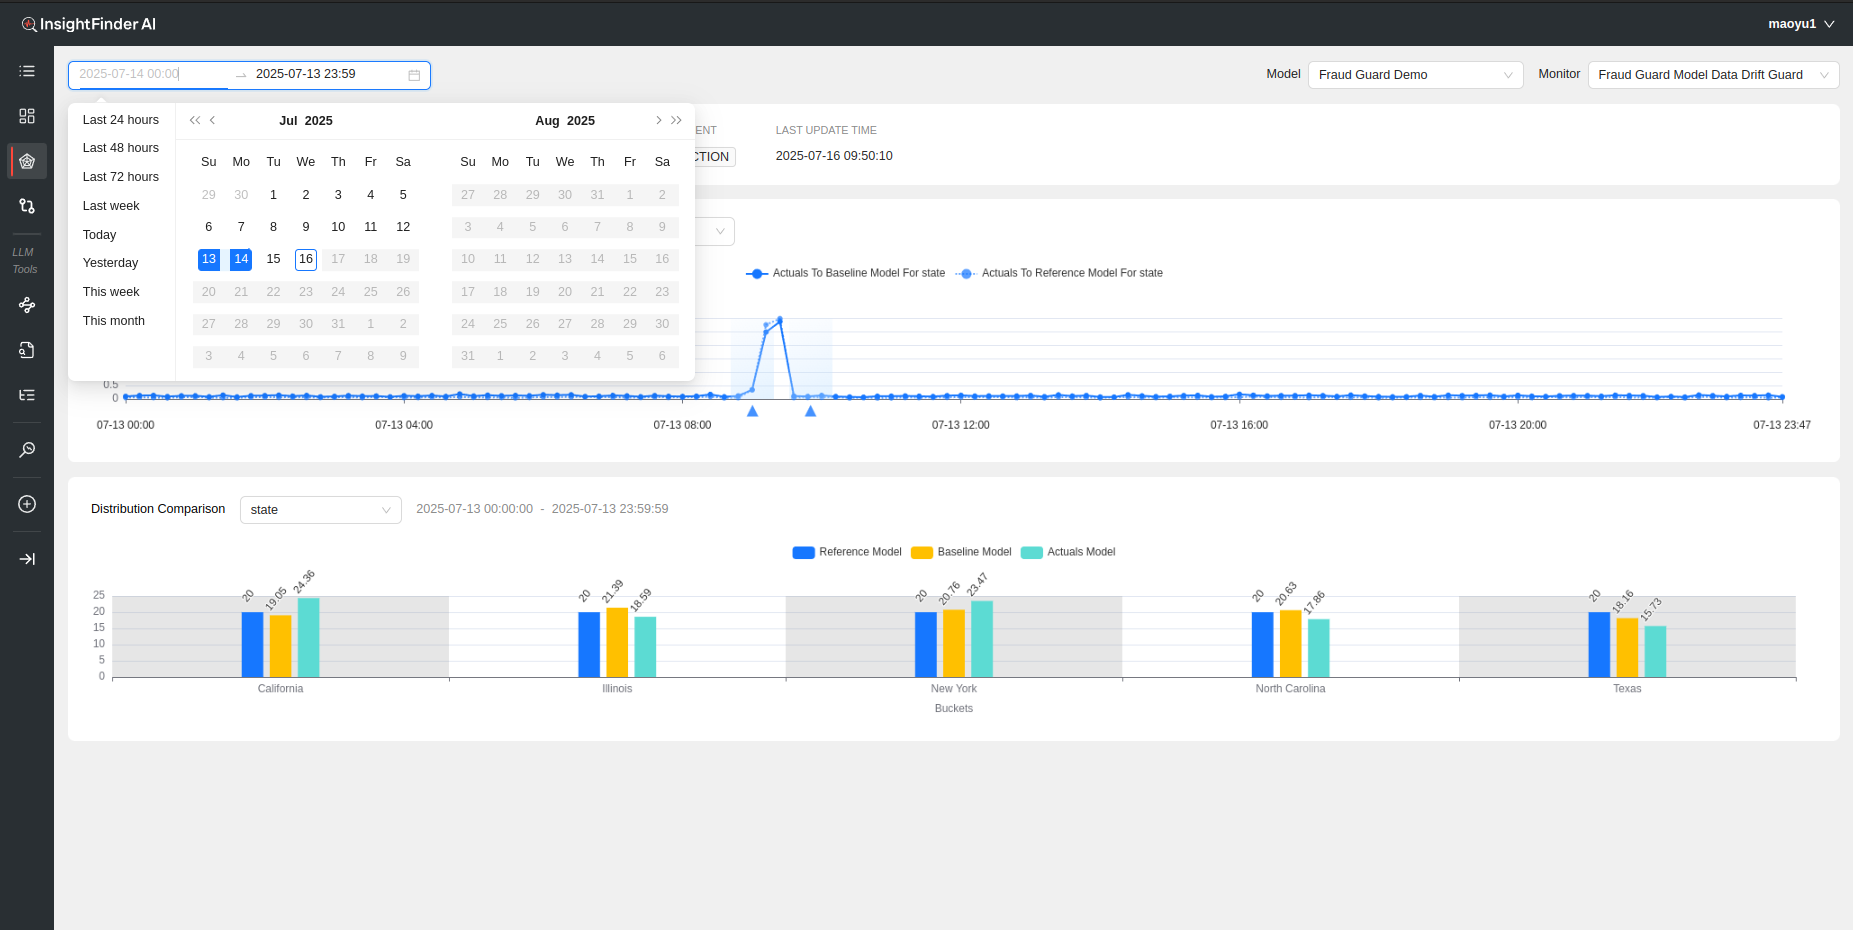
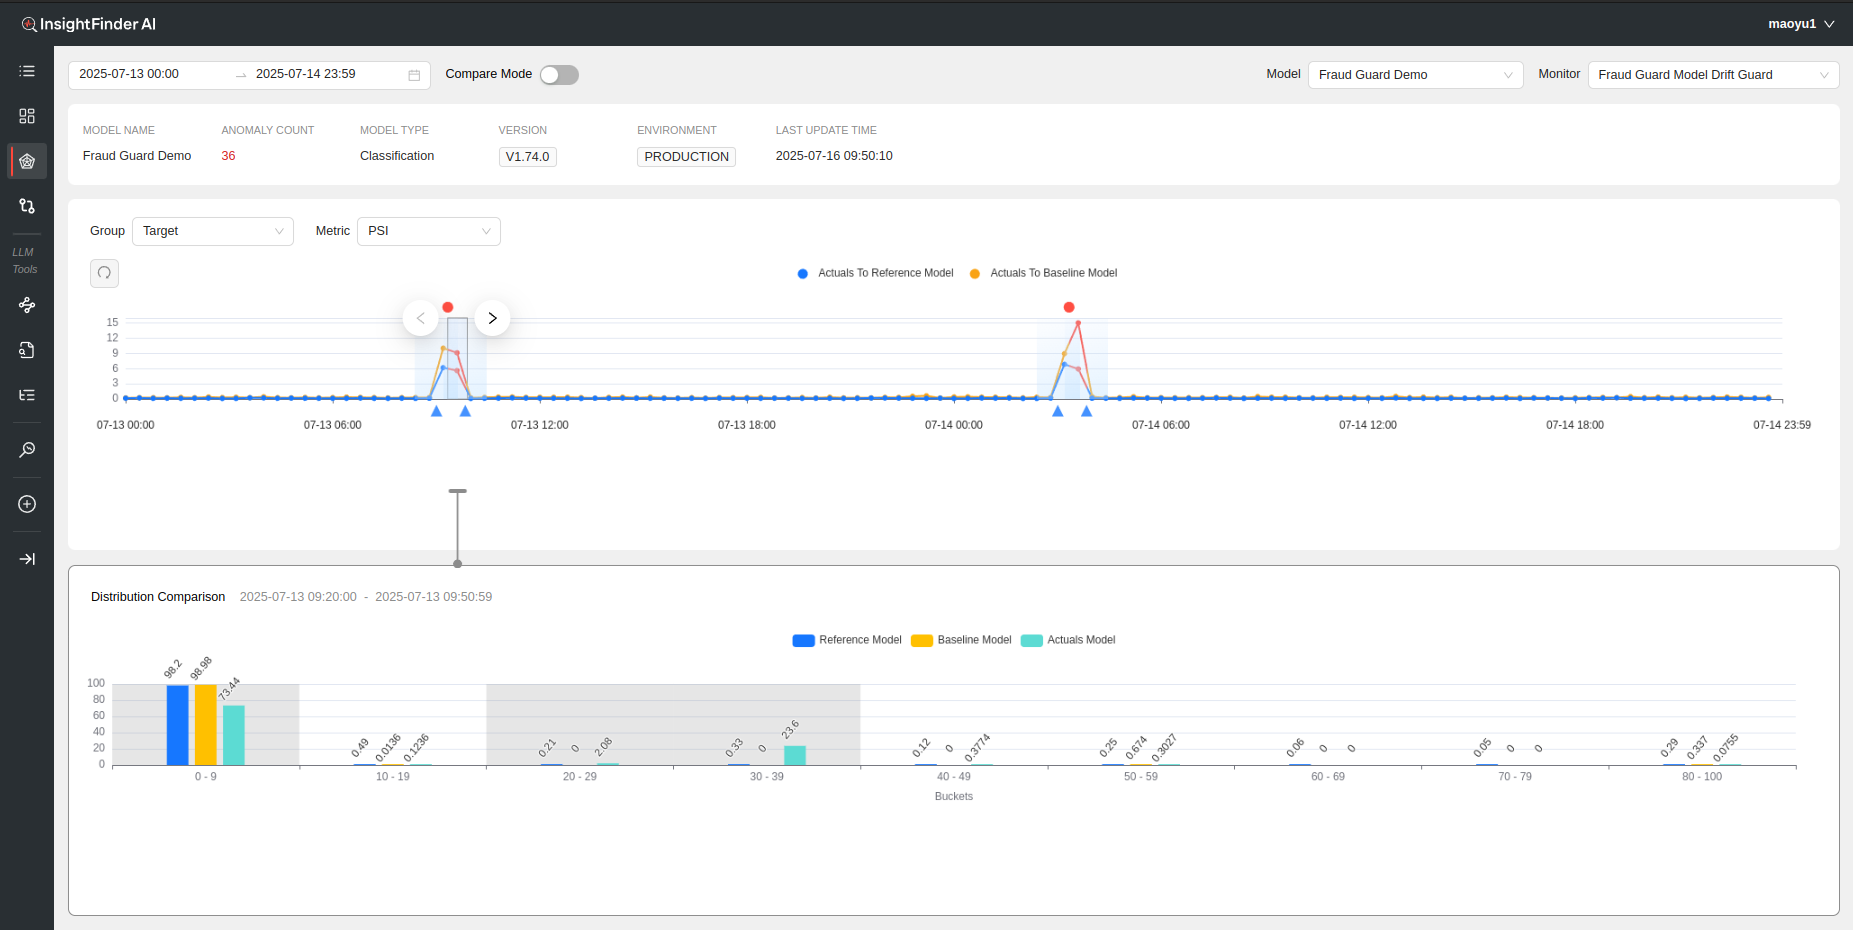
When first loading a model and monitor in the workbench, as long as the model is receiving the necessary data, data will be displayed for the past 24 hours by default for the line charts. The Period of data loaded can be adjusted on the time window selection on top left of the workbench.
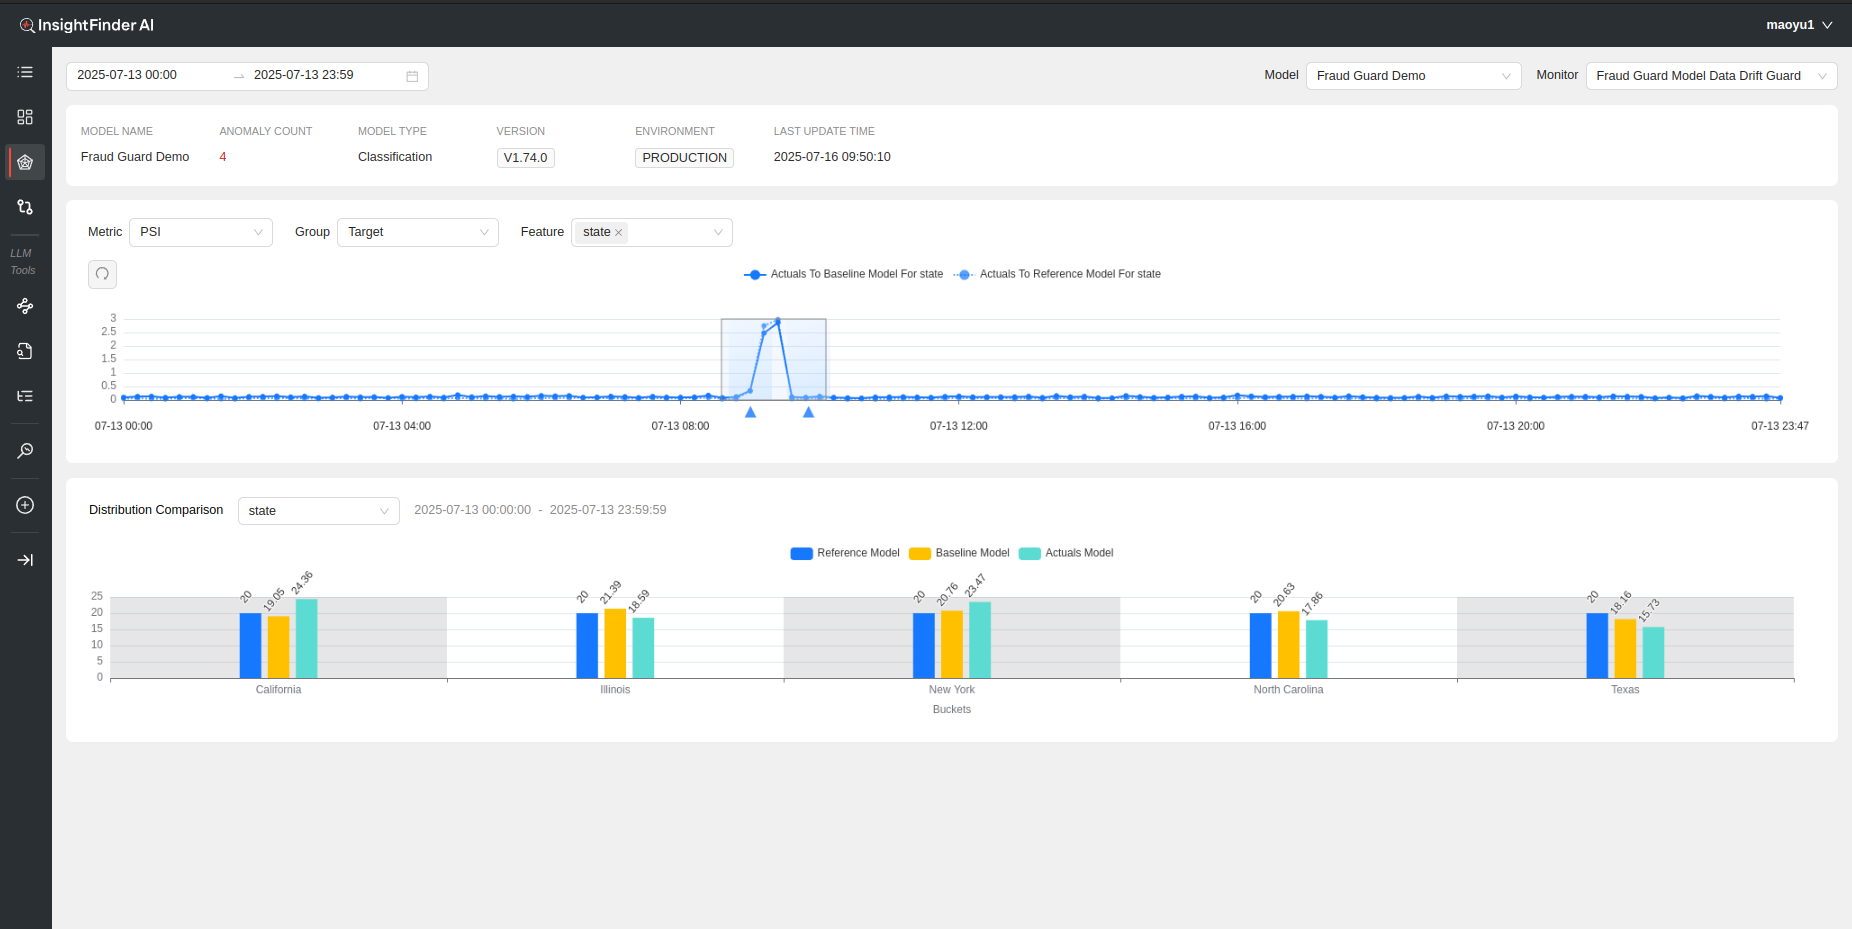
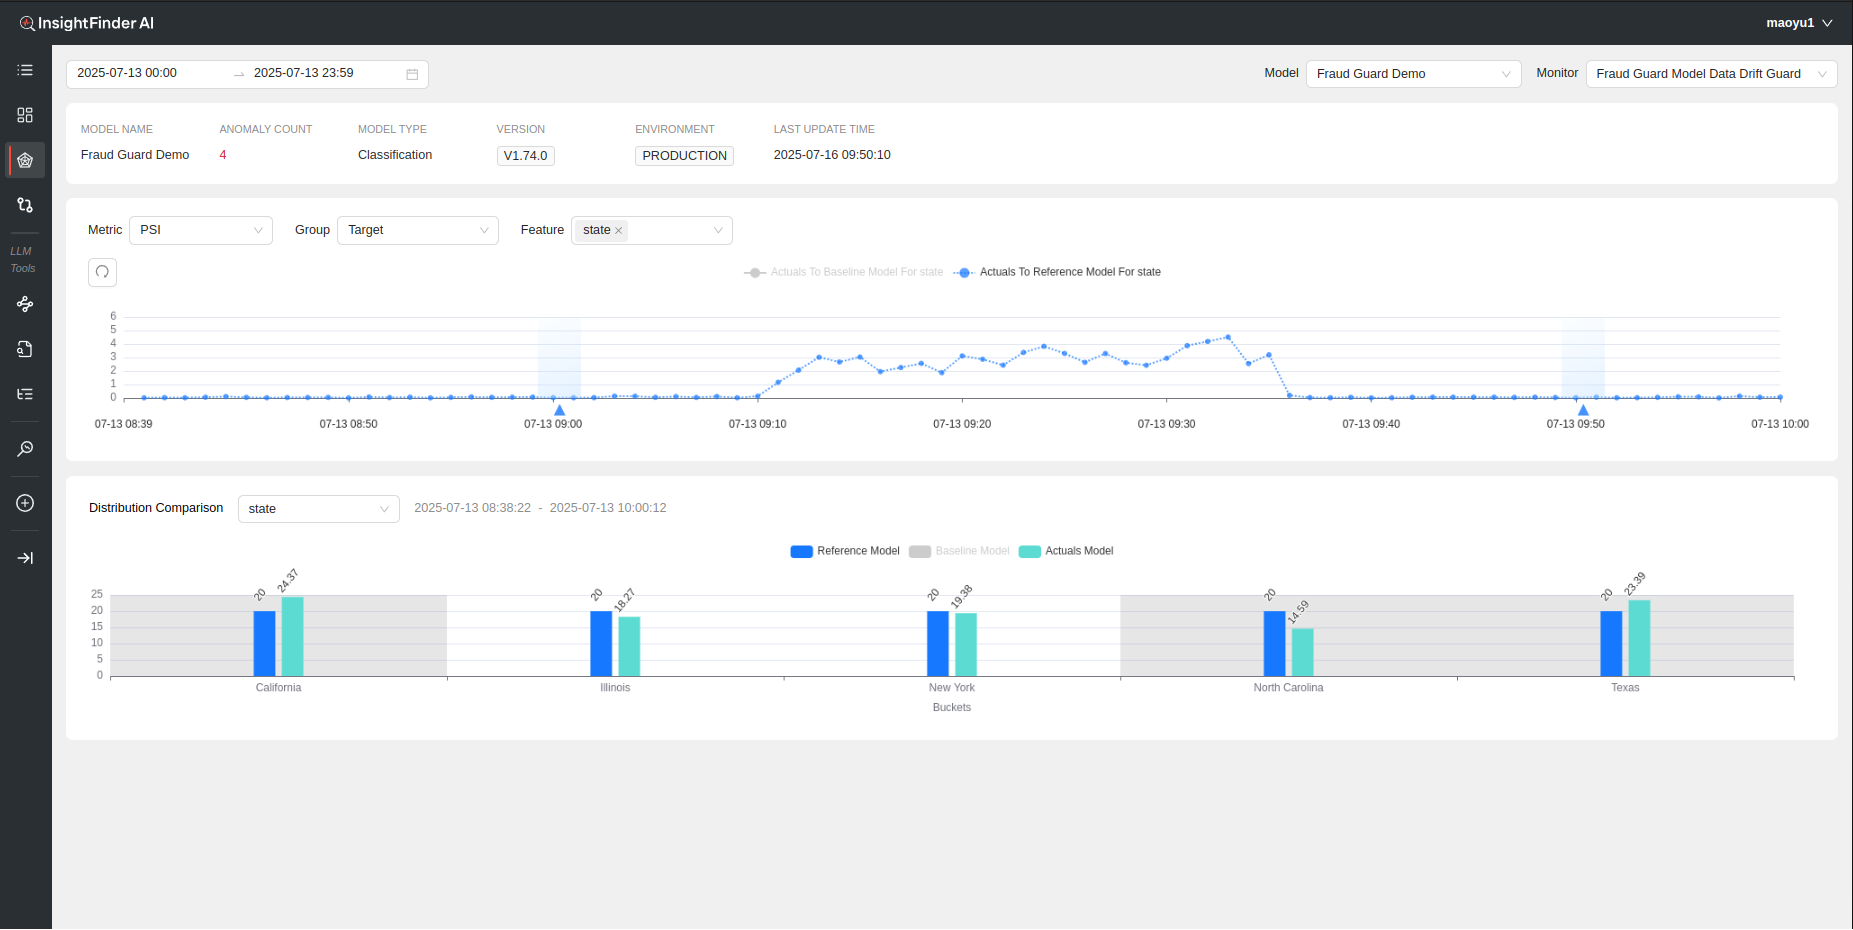
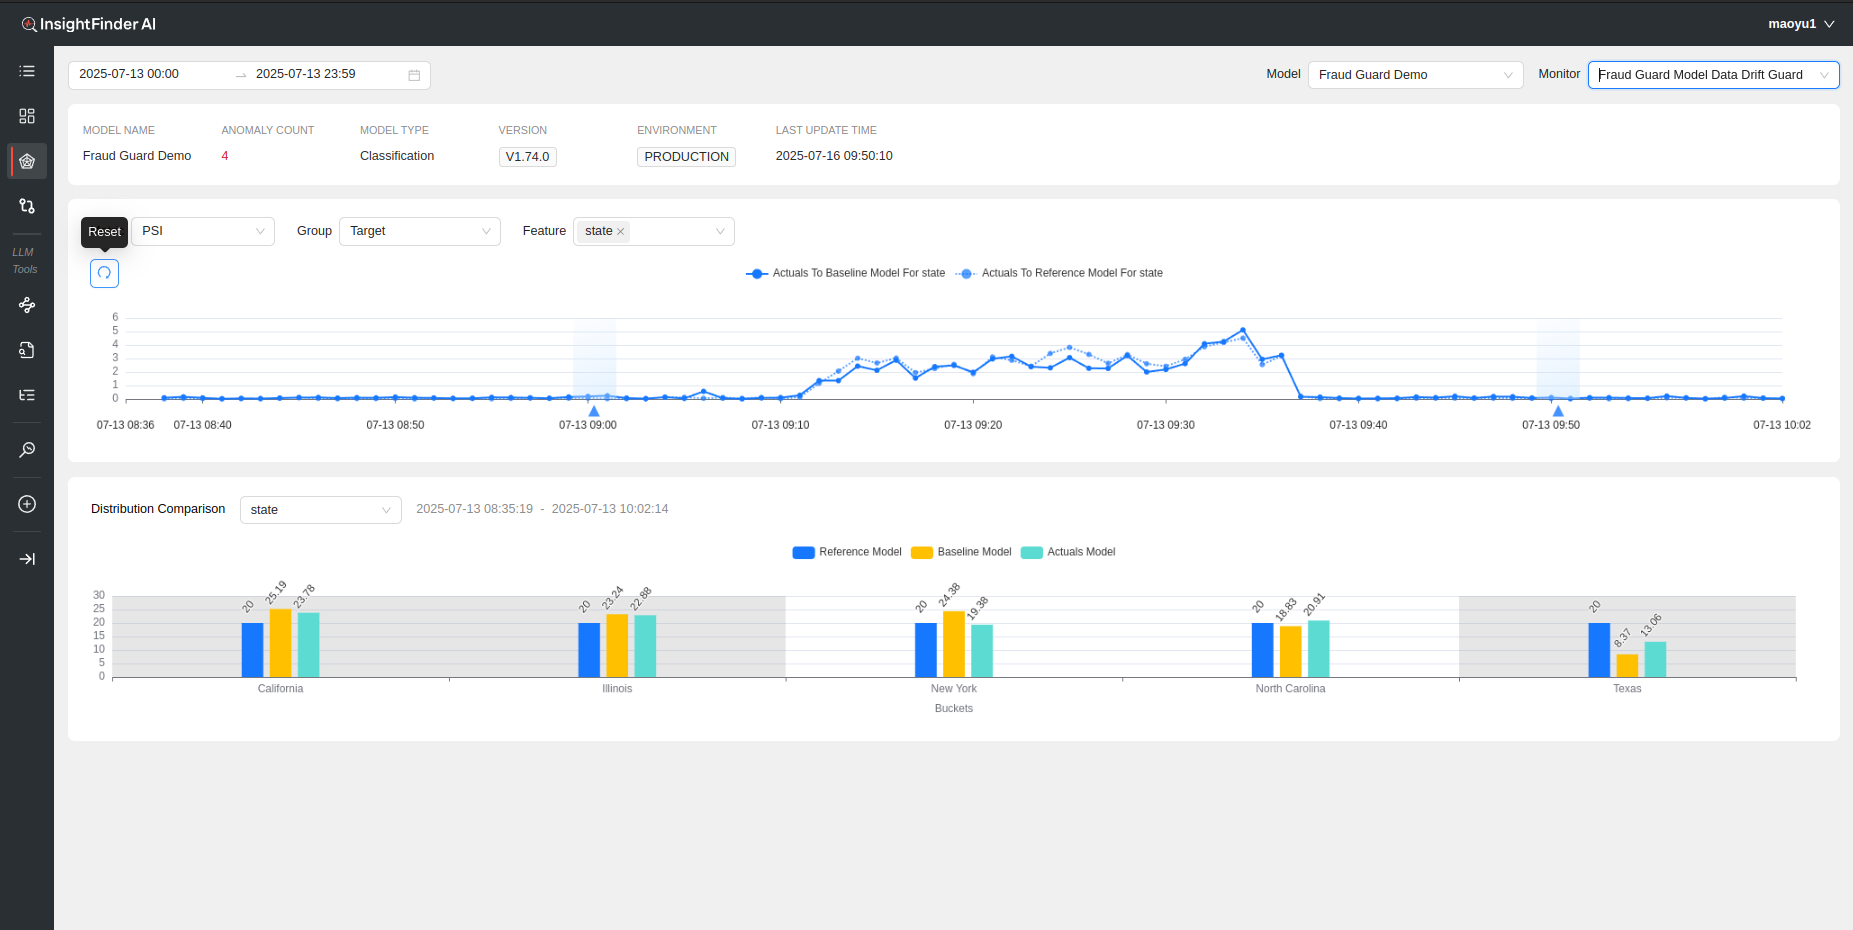
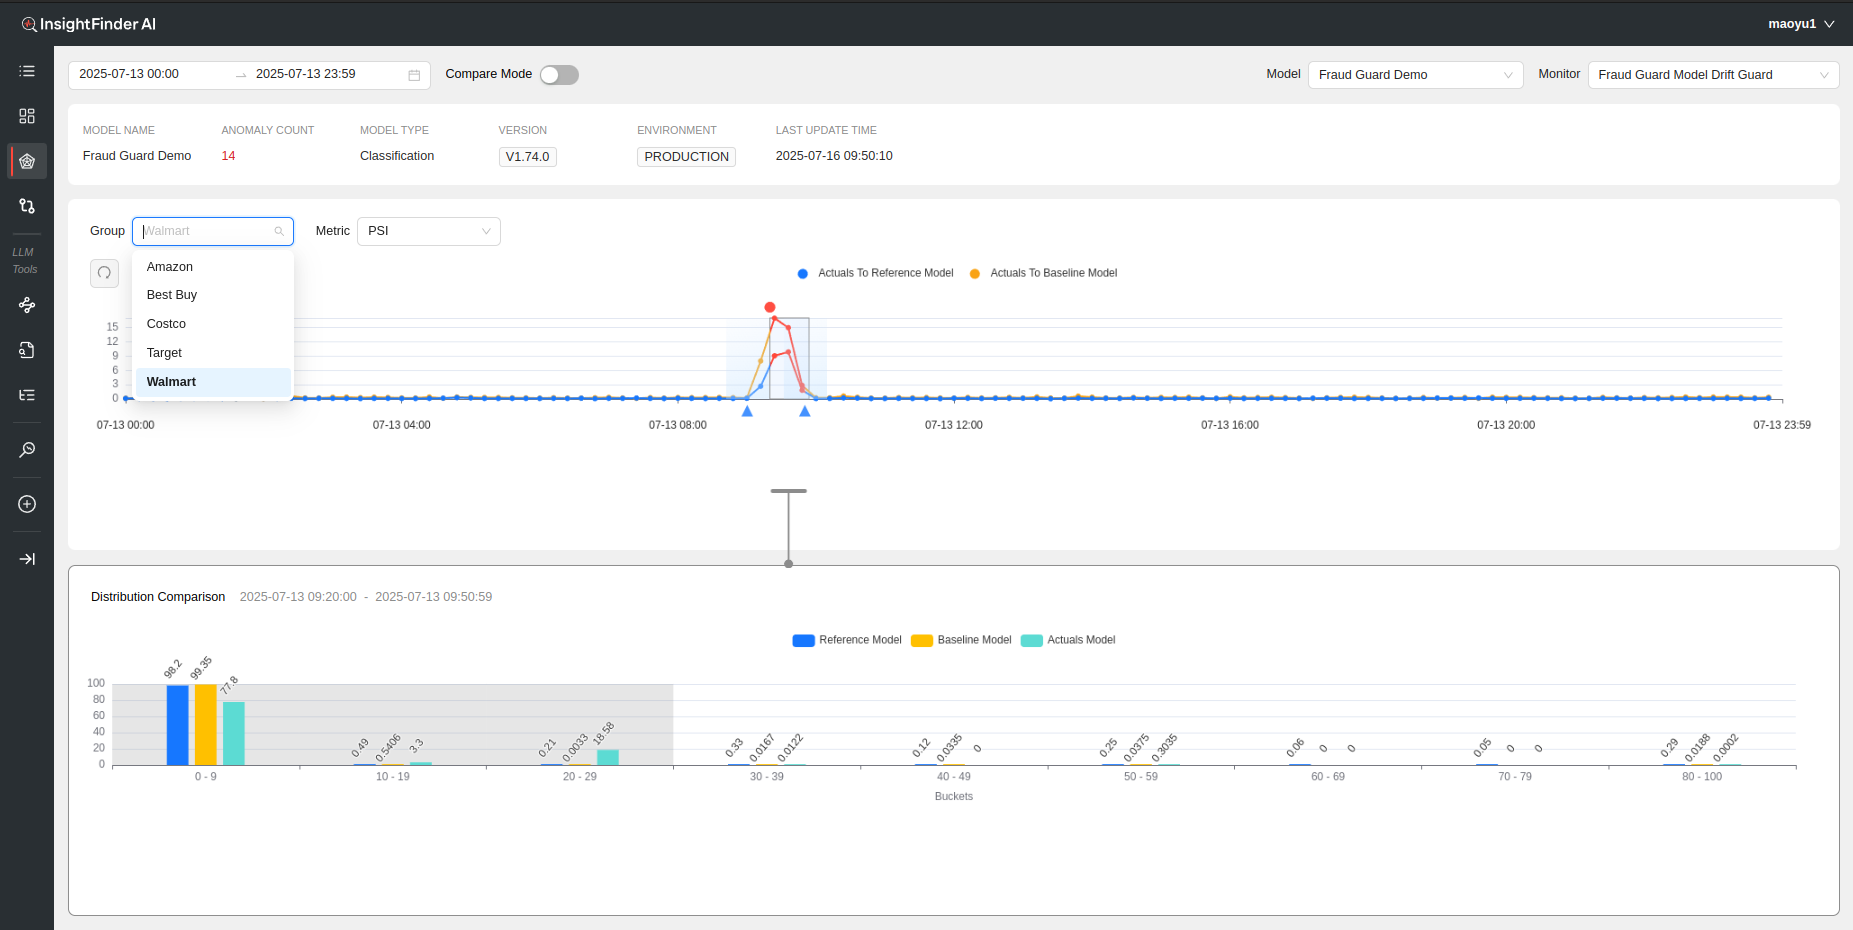
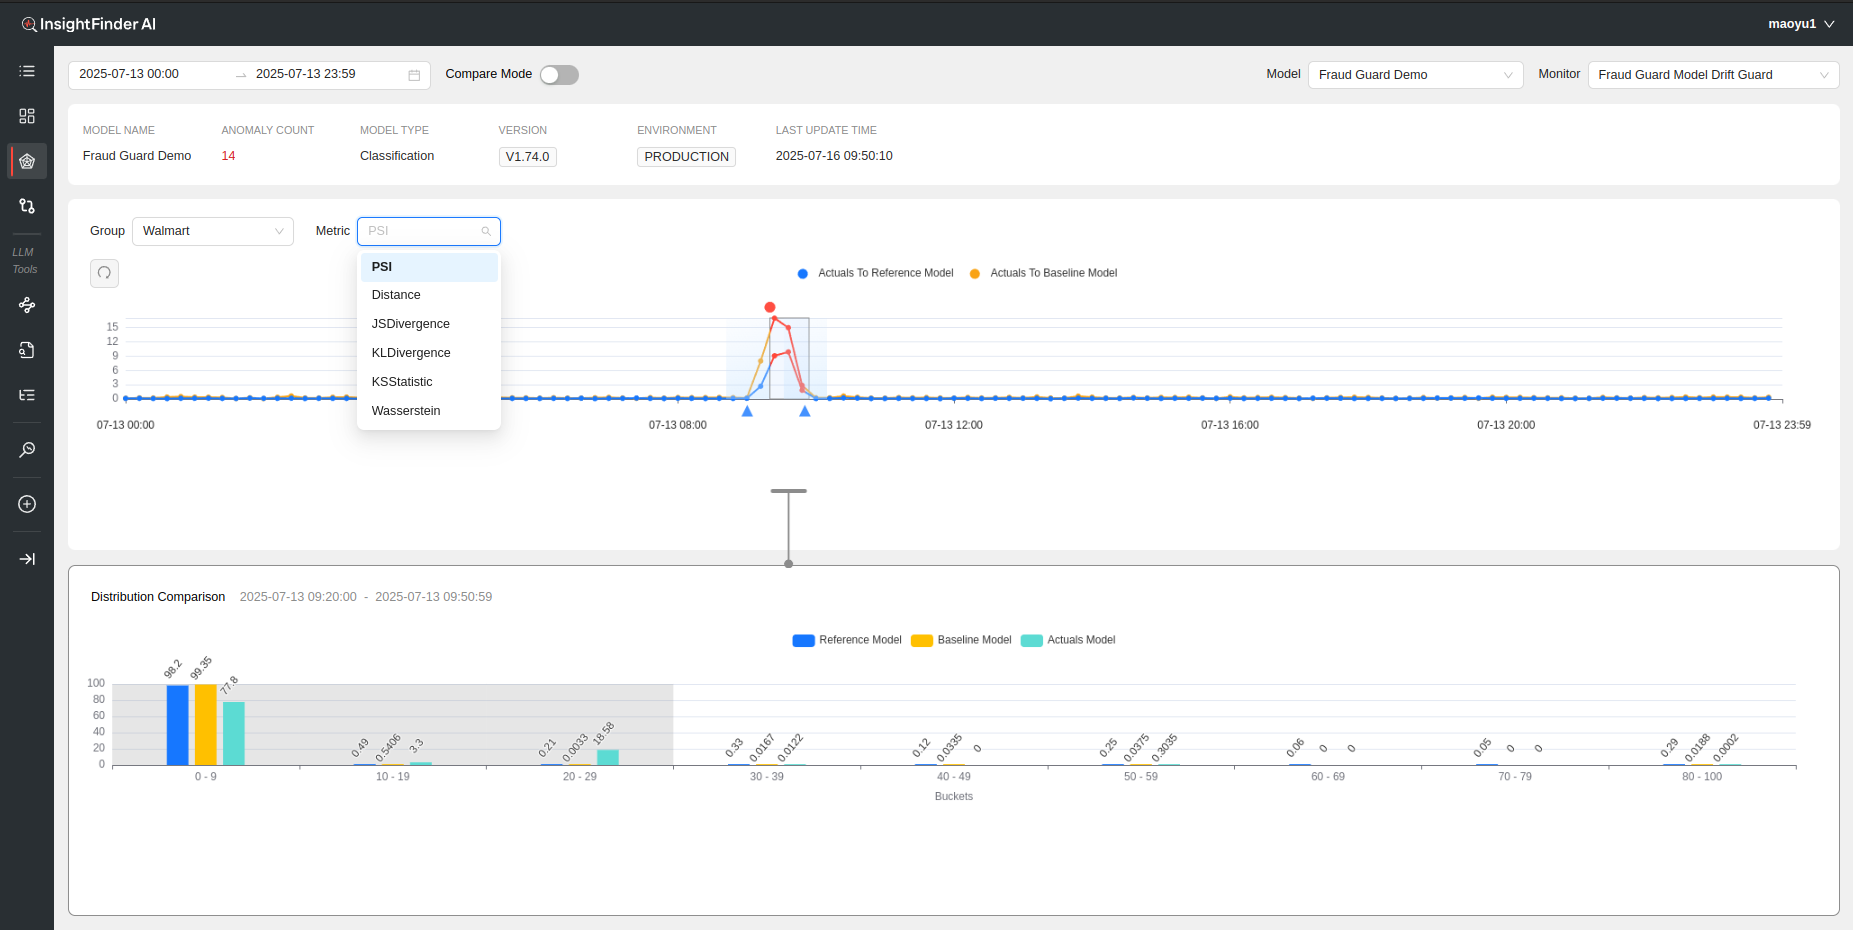
Once the desired data is loaded, most workbench monitors will load some metric line charts along with Distribution Comparison bar charts, and a summary of the model and anomaly count on top. On all the line charts, users can further increase the granularity of the displayed data by clicking and dragging over the time range wanted for analysis/visibility, and hide/show any data by clicking on the respective legends on the Chart.
For whatever duration the line charts are loaded for, the Distribution Comparison Bar Charts will highlight the 3 groups that have changed the most for that duration in a darker background for easy identification of biggest changes.
To return to the original data view, just need to click on the reset button, which will reset the line charts and distribution charts to the original selected time range.
Change Events
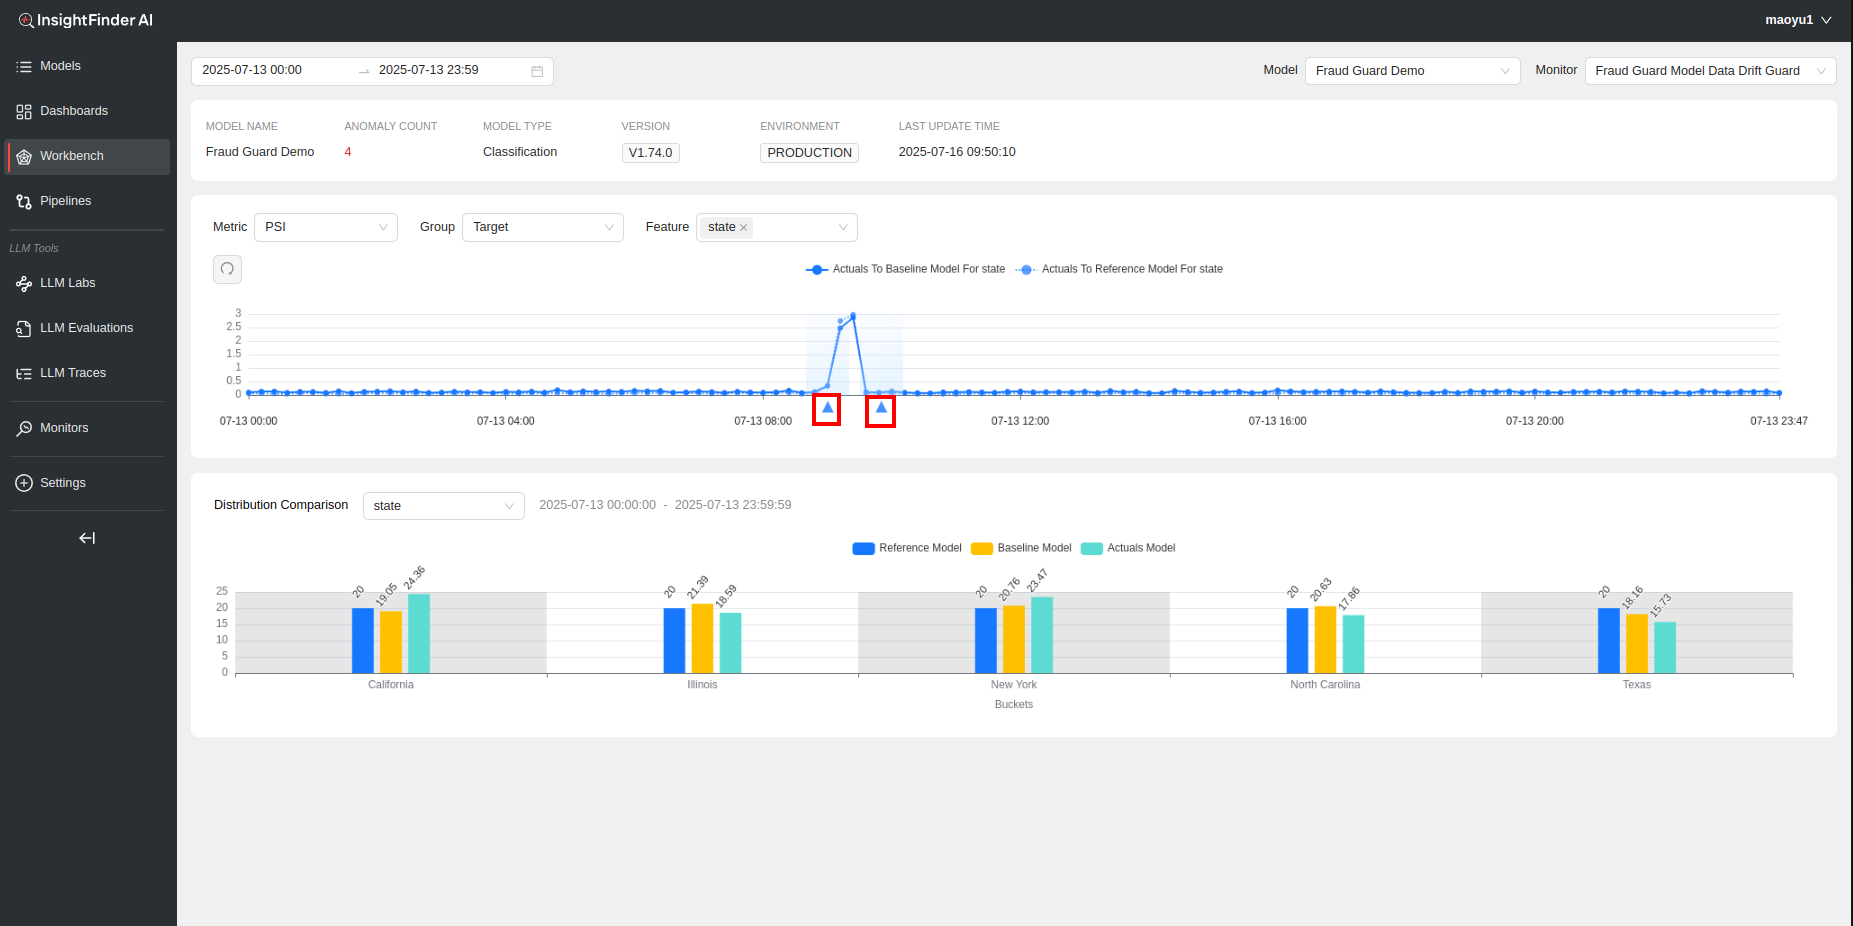
Deployment/Change Events data can be streamed to InsightFinder to keep a track of model changes, deployments, etc. to use in Root Cause Analysis and anomaly detection. If streaming Change Events data for the model, the change events can be seen underneath the line charts as triangles.
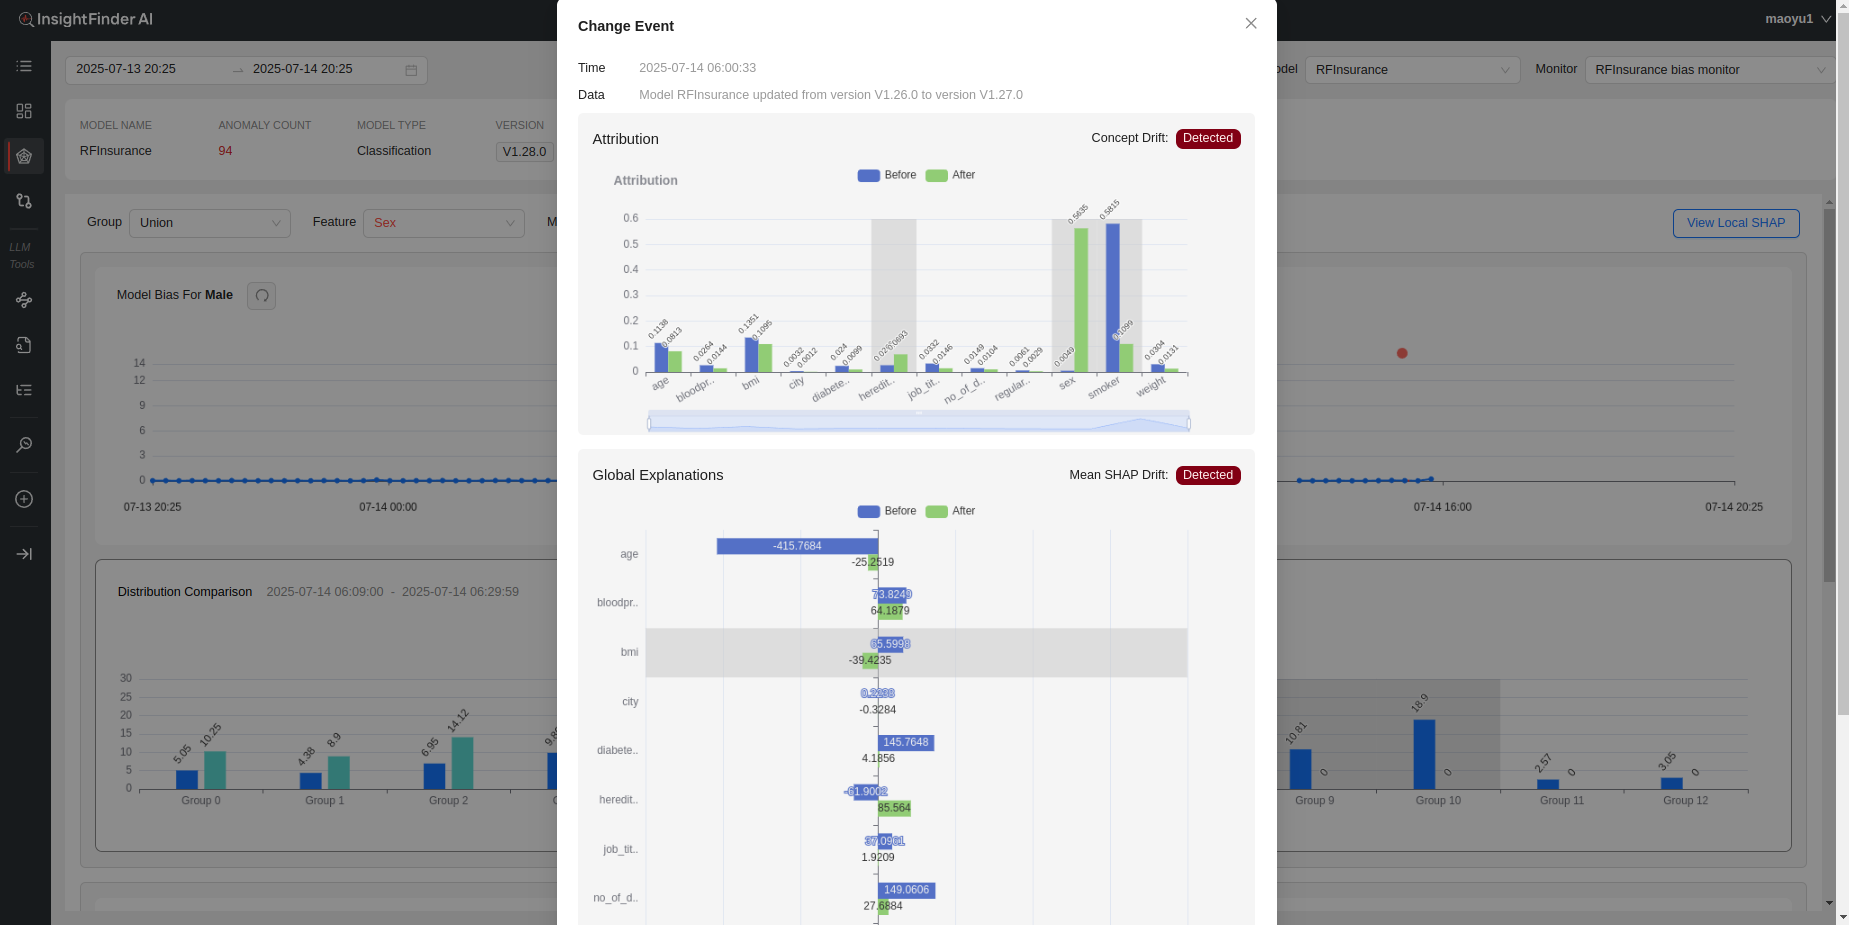
If the users are also streaming in the global SHAP values and Attributions data for the models for analysis, users can click on the respective triangle for change events to see the changes in the respective SHAP and Attribution values before and after the deployment/change, allowing users to identify the impacts of model changes.
Anomaly Detection and Root Cause Analysis
After InsightFinder has performed anomaly detection and root cause analysis, a red bubble will be displayed at the start time of the incident, if there is one. The time period for which the incident(s) lasted will be highlighted in red on the metric line chart, allowing users to see the duration of the incidents.
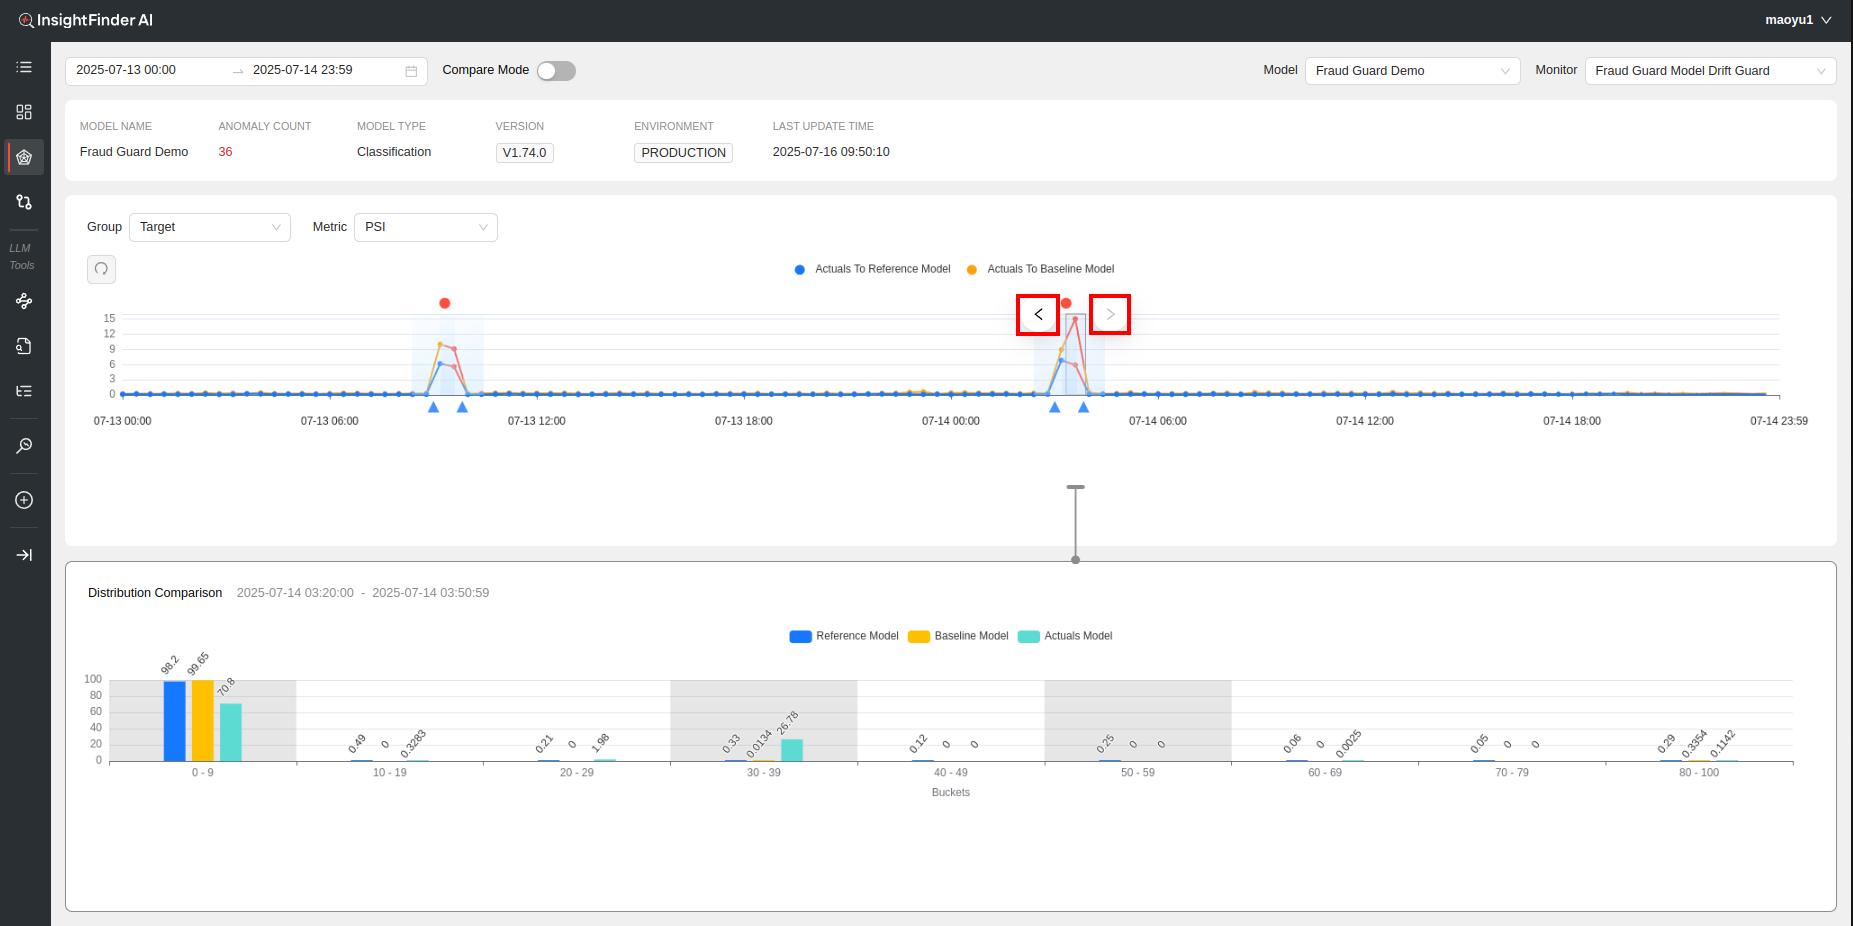
By default if there is an incident in the time range selected, the Distribution Comparison Bar Charts will be loaded for the incident time and duration. If there are multiple Incidents in the selected time range, the bar charts will default to the time range of the first incident on the timeline. Clicking On the > Arrows around the incident allows the users to quickly switch between the multiple incidents’ Distribution Charts.
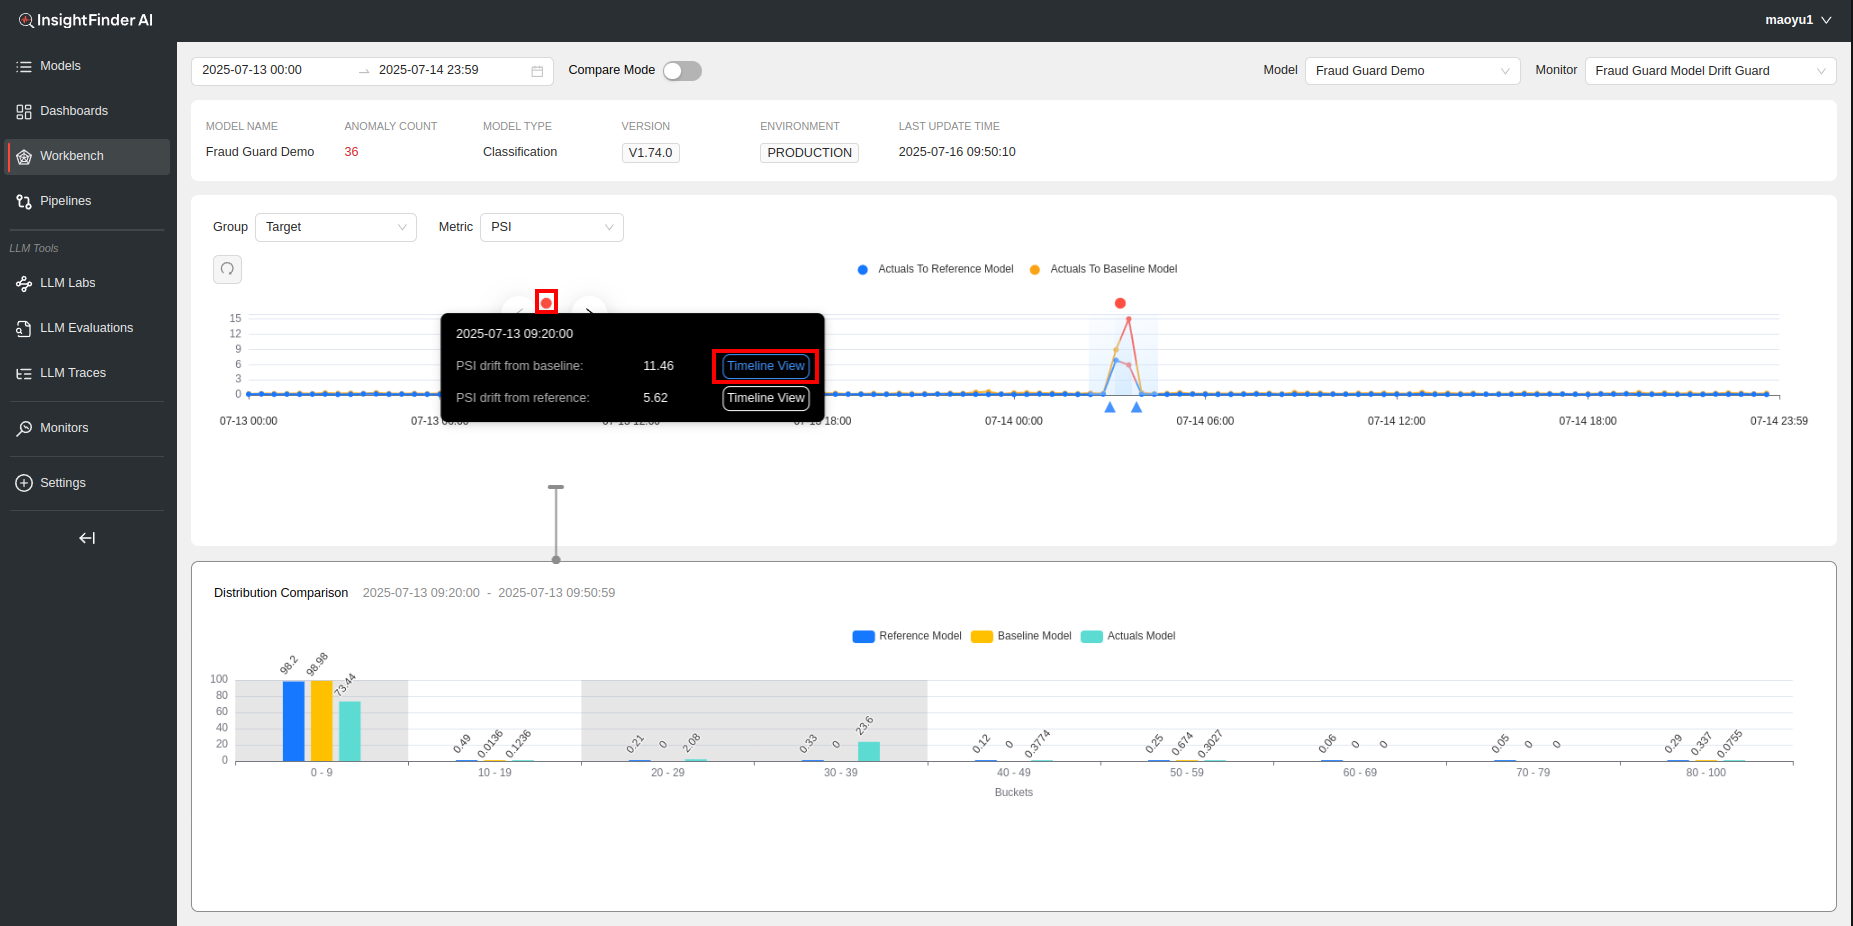
Hovering over the red circle will display all the incidents for all features and metrics that were detected by InsightFinder for that particular time period.
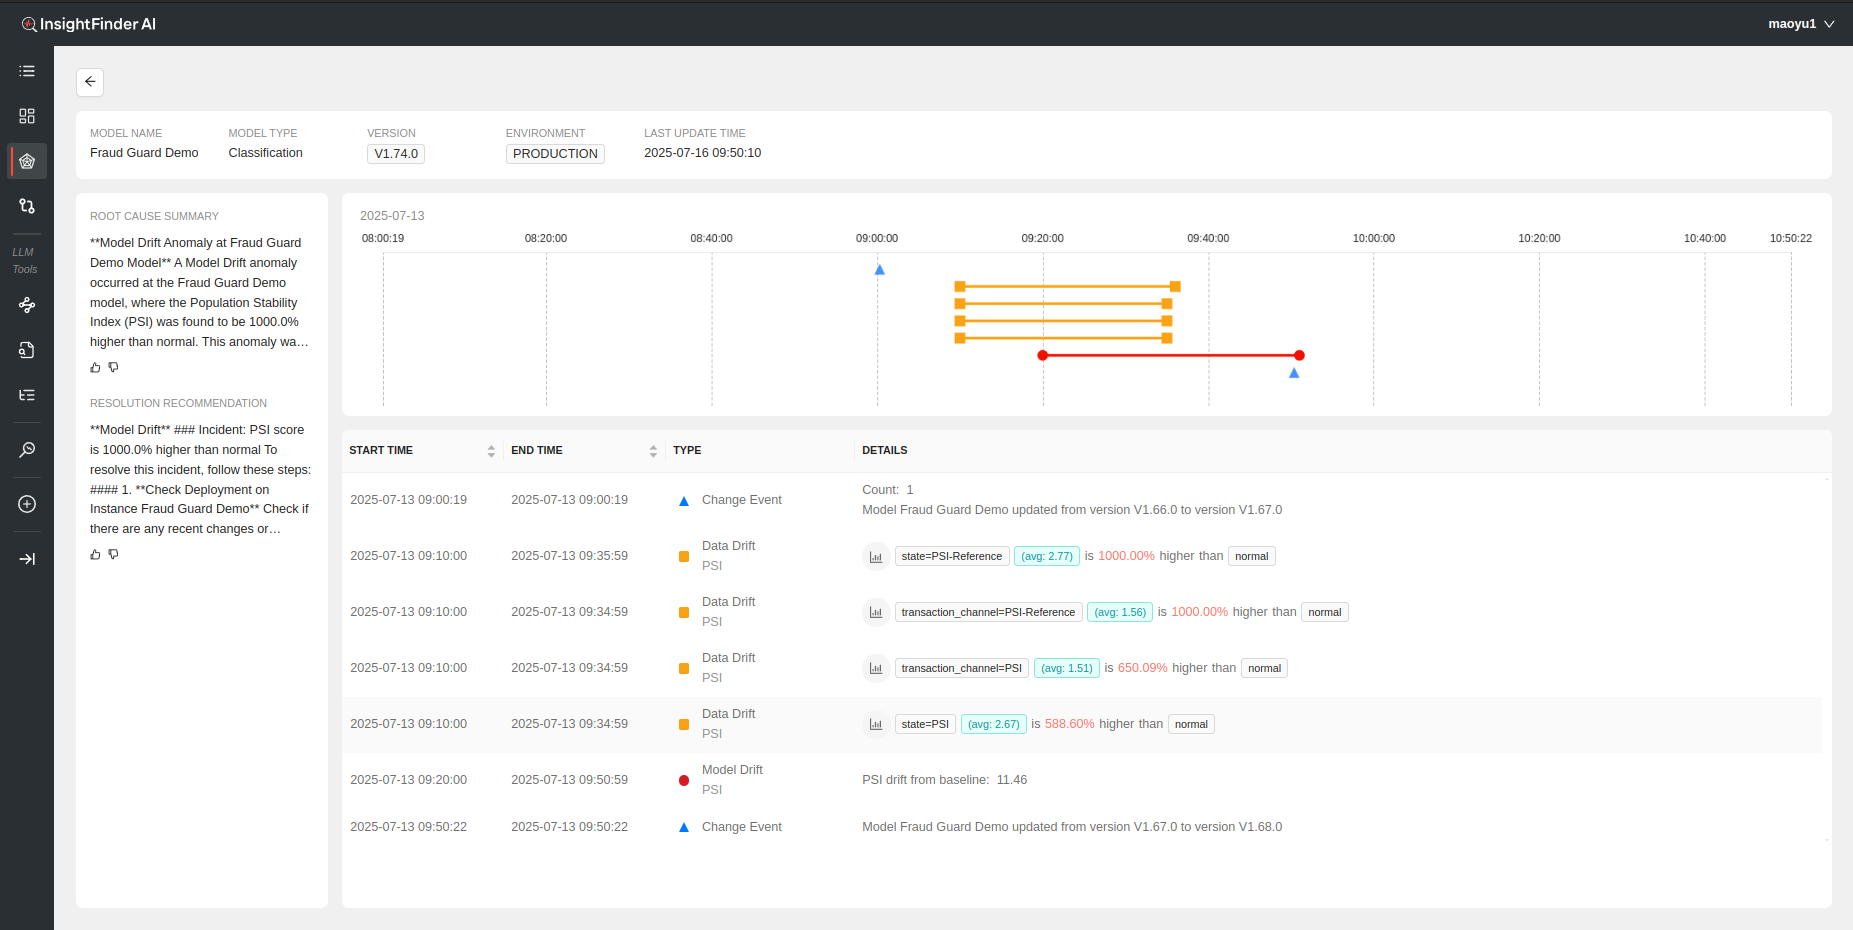
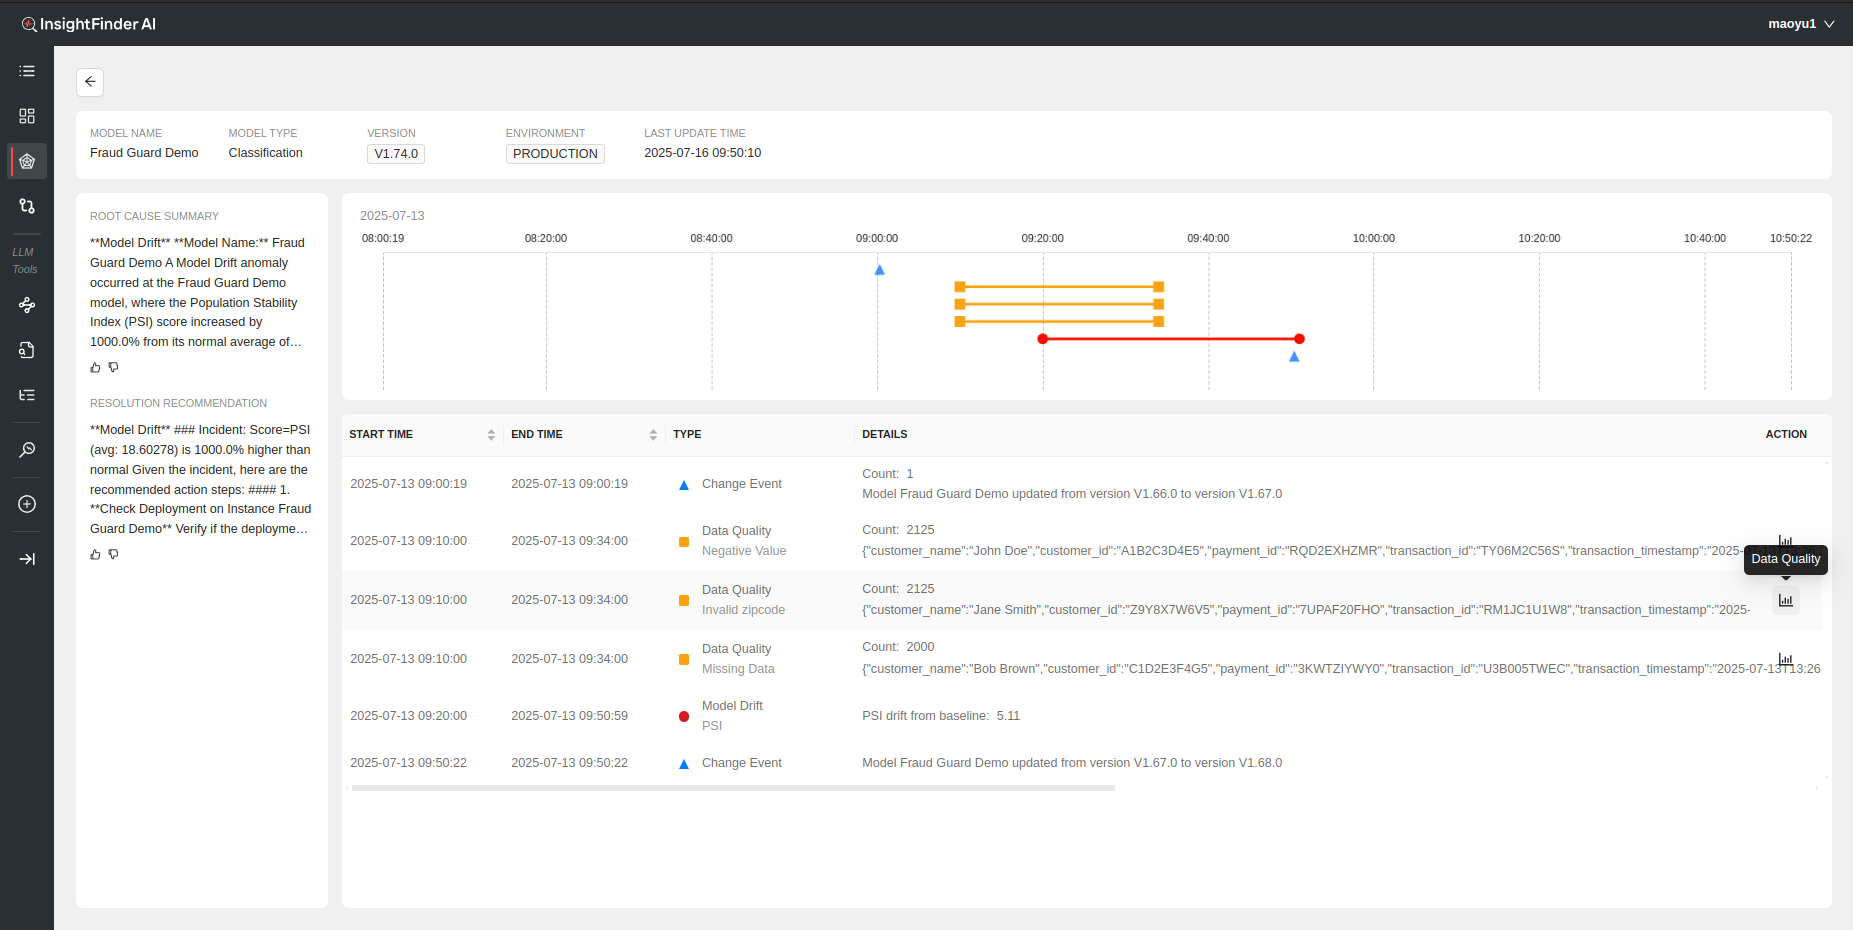
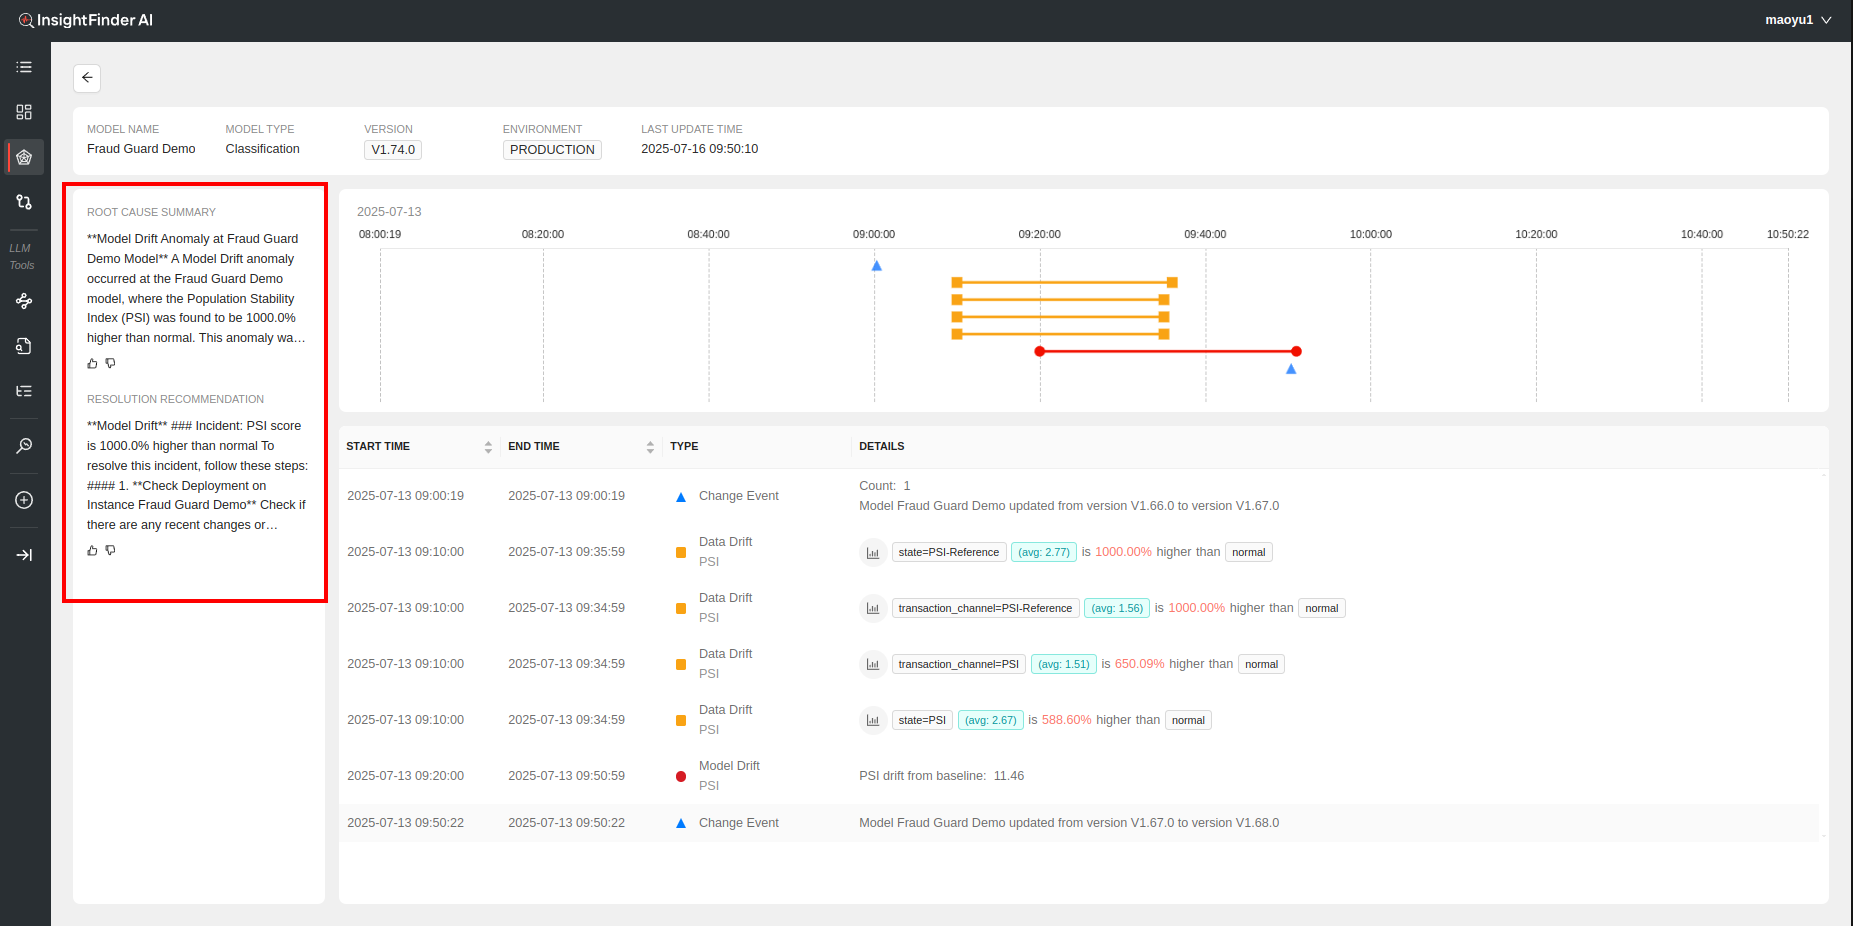
By clicking on the ‘Timeline View’ for the respective incidents redirects the user to the Root Cause Analysis Page, which displays the root cause chain with timeline view for better visual understanding.
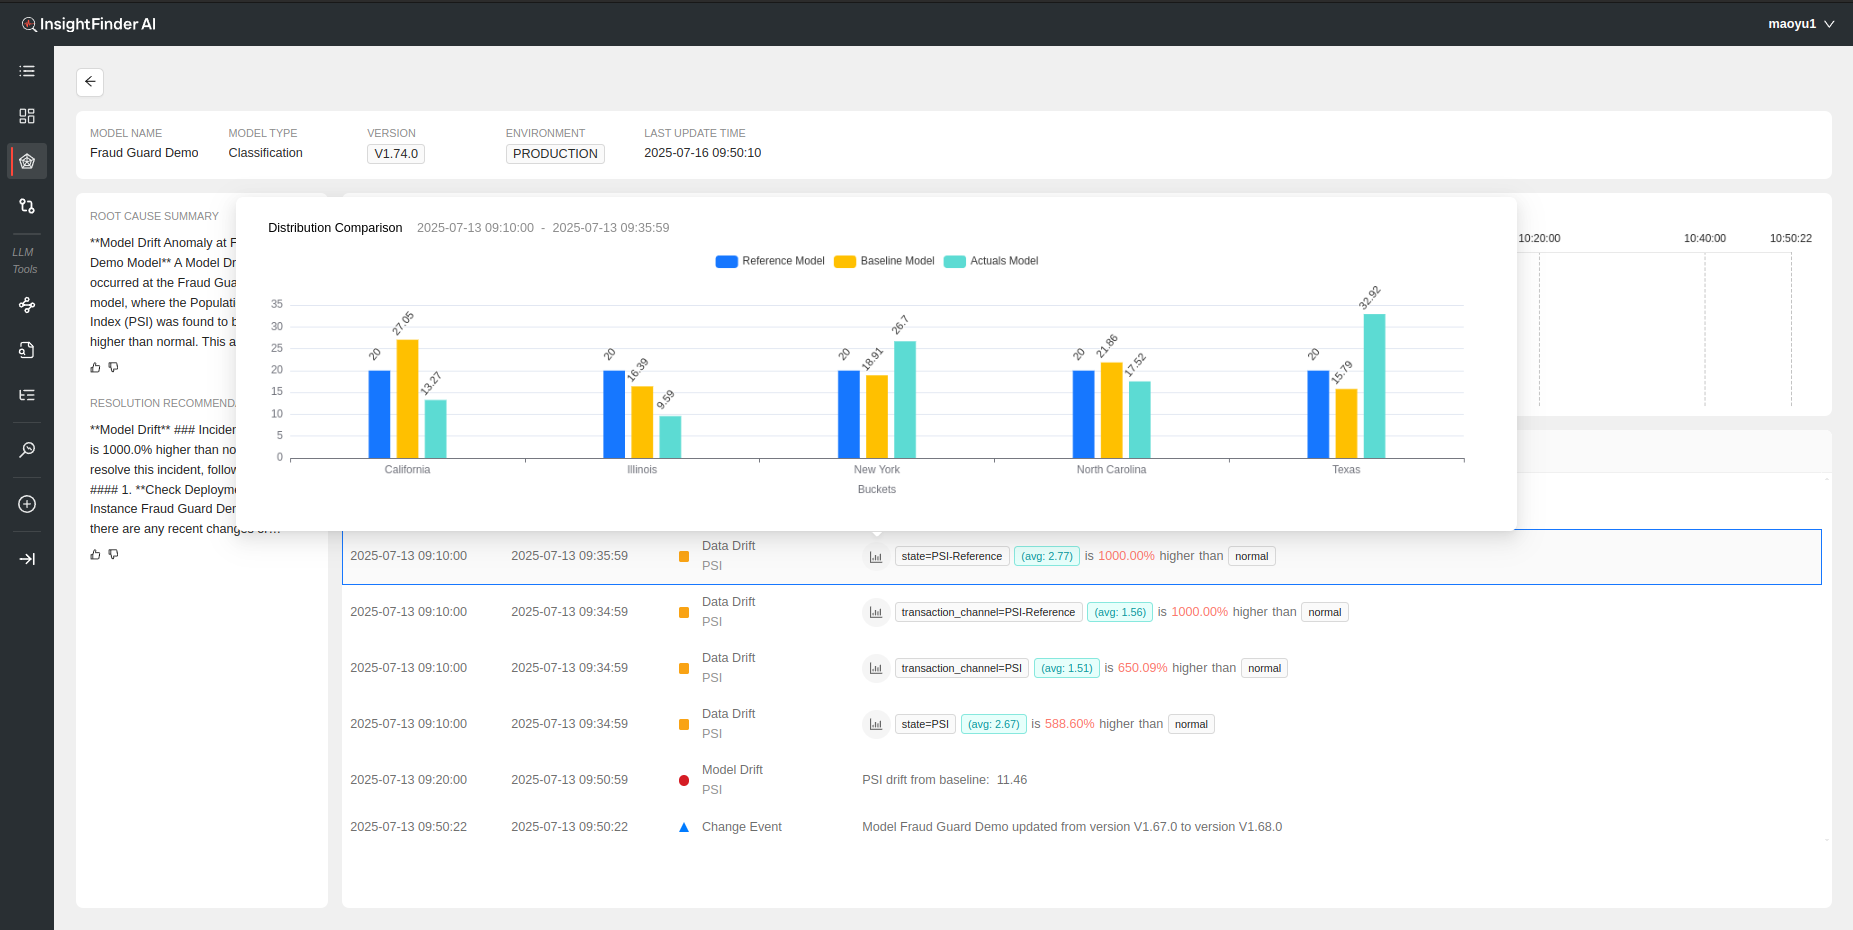
Depending on the Root Causes Discovered by InsightFinder, certain actions are available to users to further be able to dig into possible issues. For example, if a Data Drifty issue is identified in the chain, users can view the distribution comparison for the anomaly detected. If Data Quality issue is identified in the chain, users can click on the Action button for it to be redirected to that specific data quality issue timestamp and workbench.
On the Left of the Timeline View both the Root Cause Summary and the Recommended Steps for Resolution can be seen to help operators/users identify and resolve issues quickly, generated by InsightFinder’s LLM Model.
Hitting the back button on top left will take the user back to the Monitor workbench.
Individual Monitors Workbench
Model Drift
Model Drift Analysis is done on the output data from the model to monitor the performance of the model over time and identify any degradation in predictions.
The various distribution comparison metrics calculated by InsightFinder AI WatchTower can be selected from the drop down menu to analyze the specific metrics, along with the specific group wanted for monitoring the drift.
Below the line chart the workbench also displays Distribution Comparison per Output category. The bucketing (if non categorical output) and output key/field to monitor are defined when creating the Model Drift Monitor. This allows users to view the data and compare the outputs w.r.t the reference models and historical model.
Compare Mode
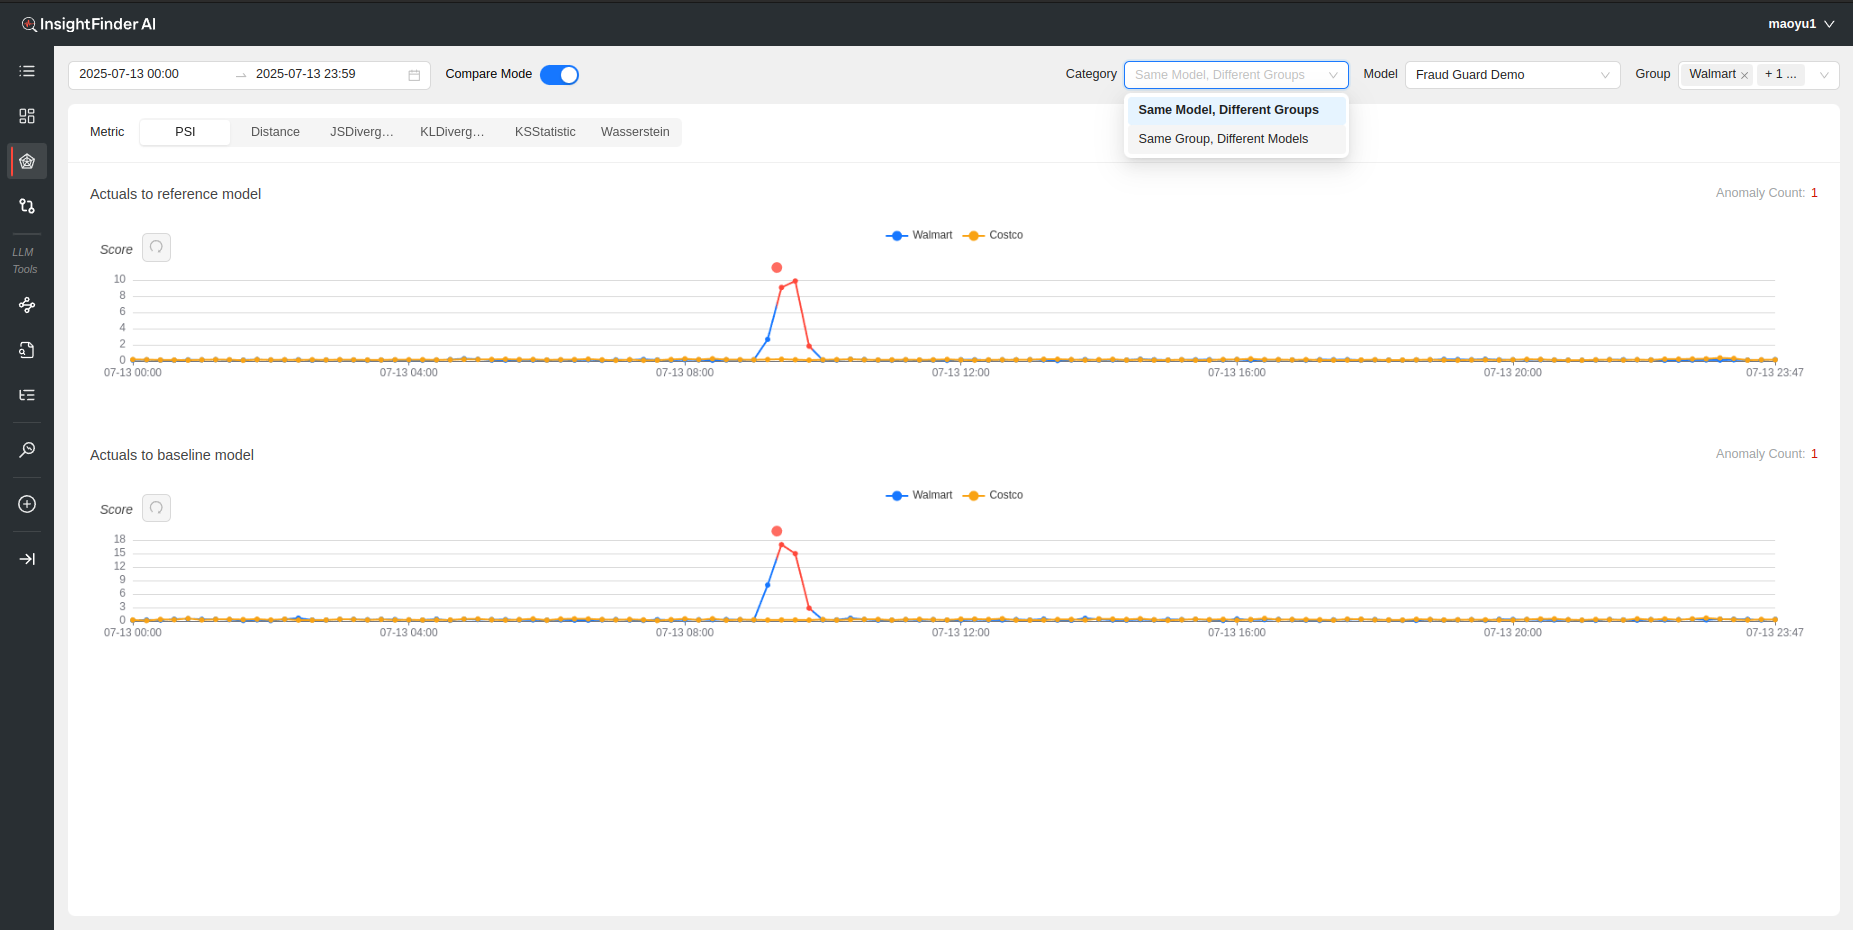
On Top of the model monitor workbench, Compare mode can be toggled on/off. Compare mode allows the users to compare the Distribution metrics of the model for different groups, or to compare the metrics for different models for the same group (assuming models are similar).
Data Drift
Data Drift Analysis is done on the input data for the model to determine whether it has changed over time, affecting the output of the model.
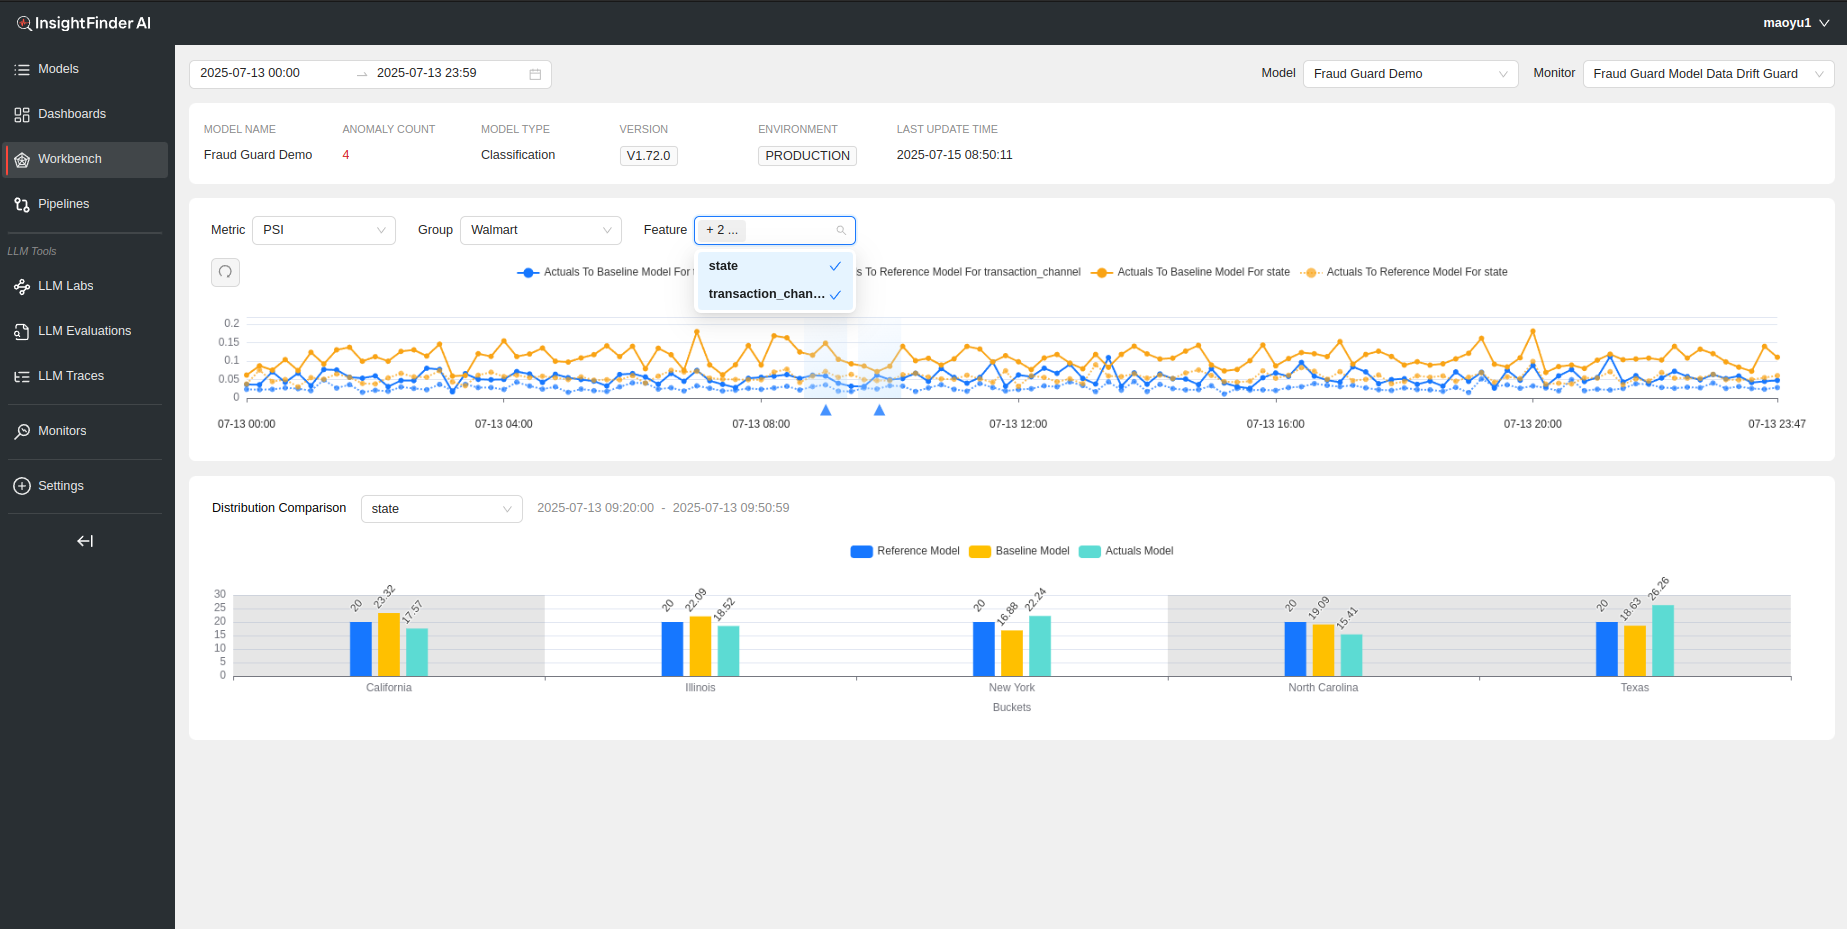
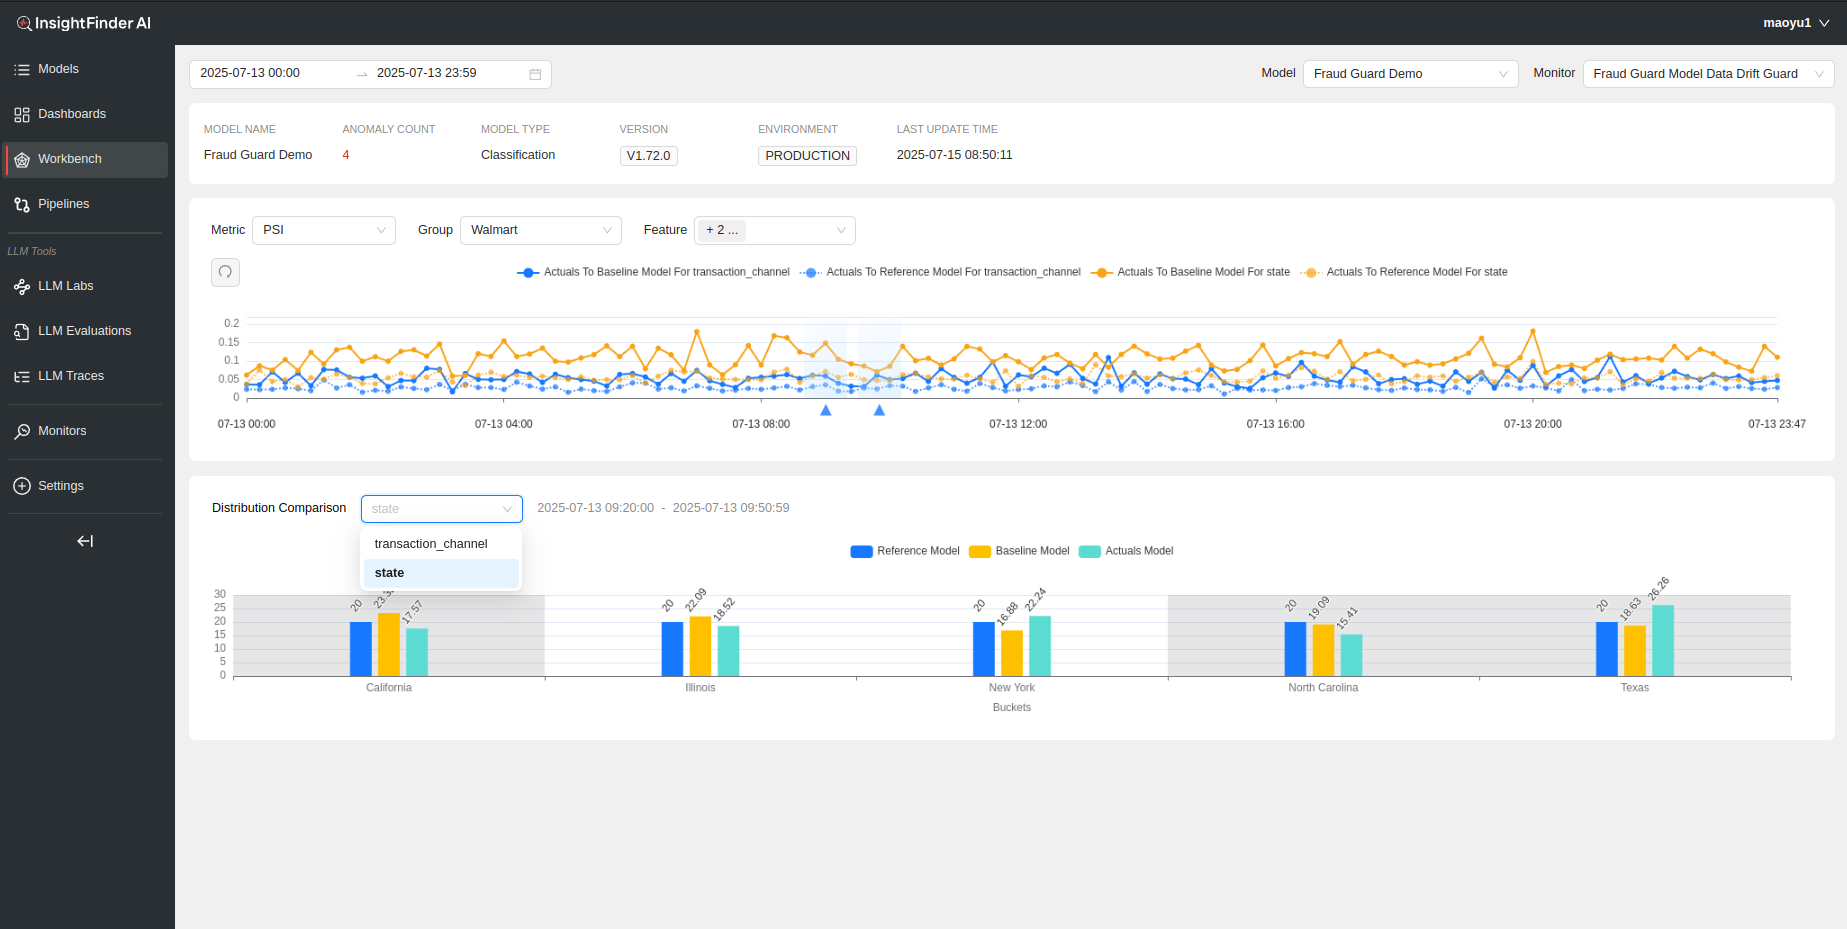
The workbench for Data Drift is very similar to Model Drift with a few differences. For Distribution comparison metrics and bar charts, users can now also choose the feature (configured during monitor creation) to see the distribution of the data based on individual features.
Model Bias
Model Bias Workbench detects how sensitive or responsive the model’s output is for one group compared to the others.
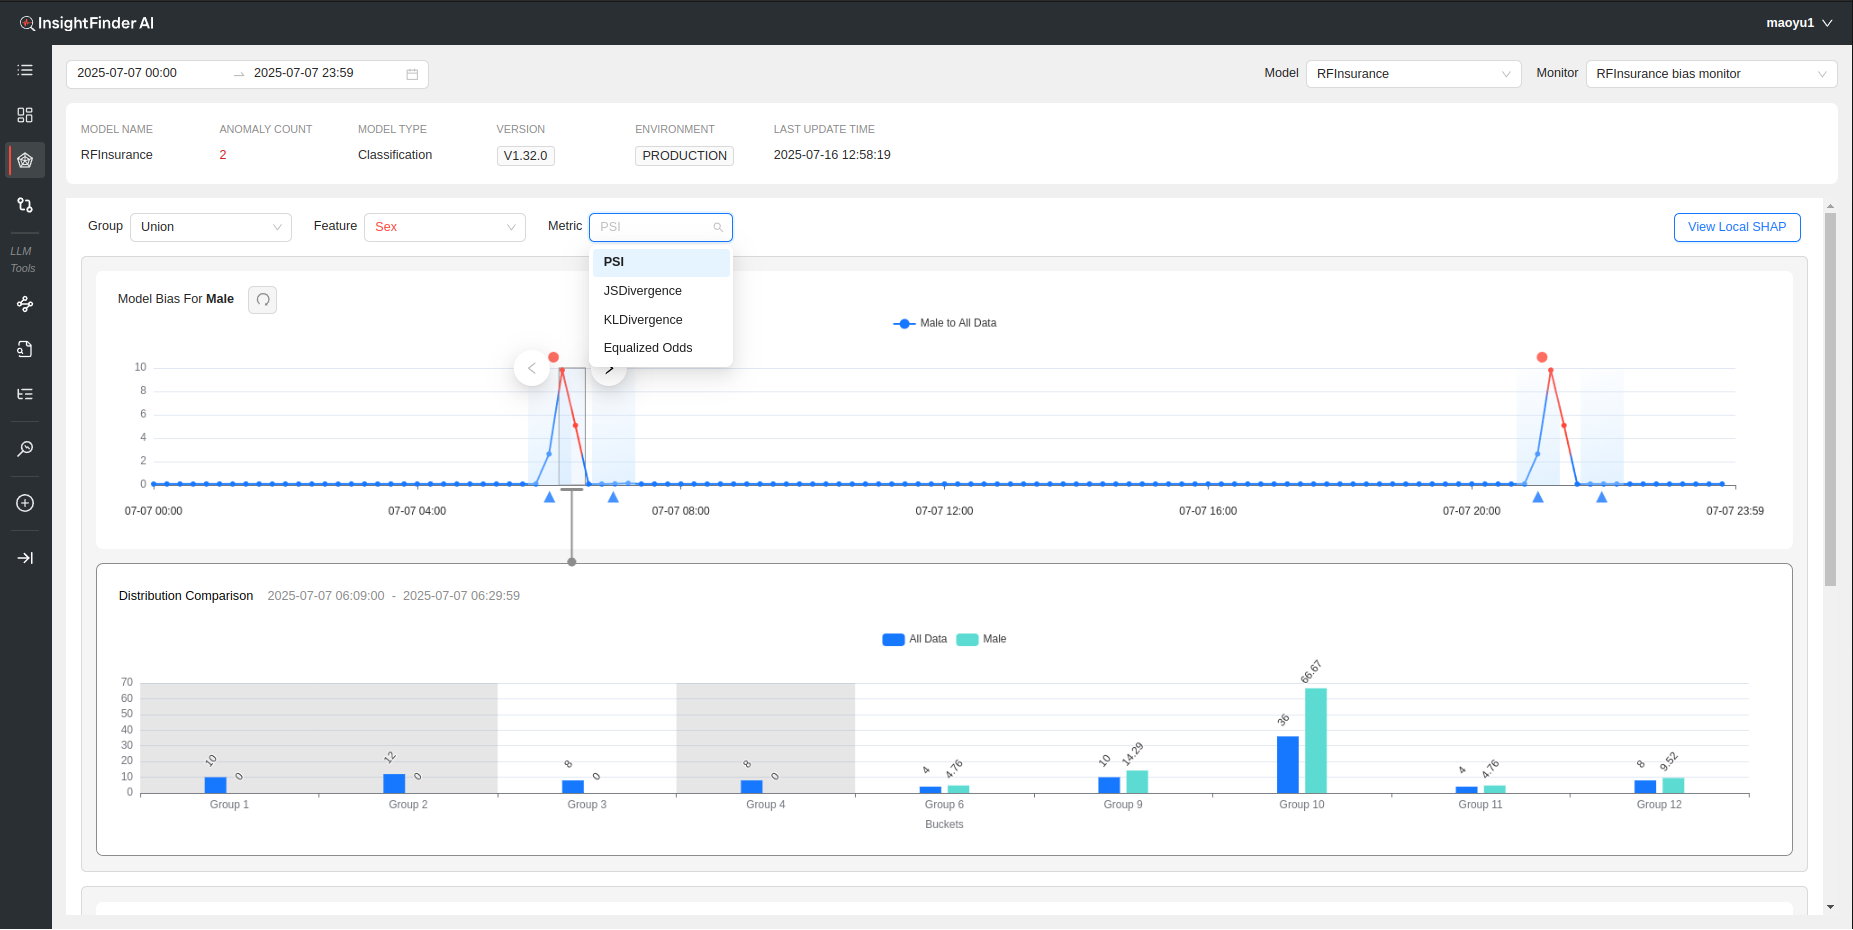
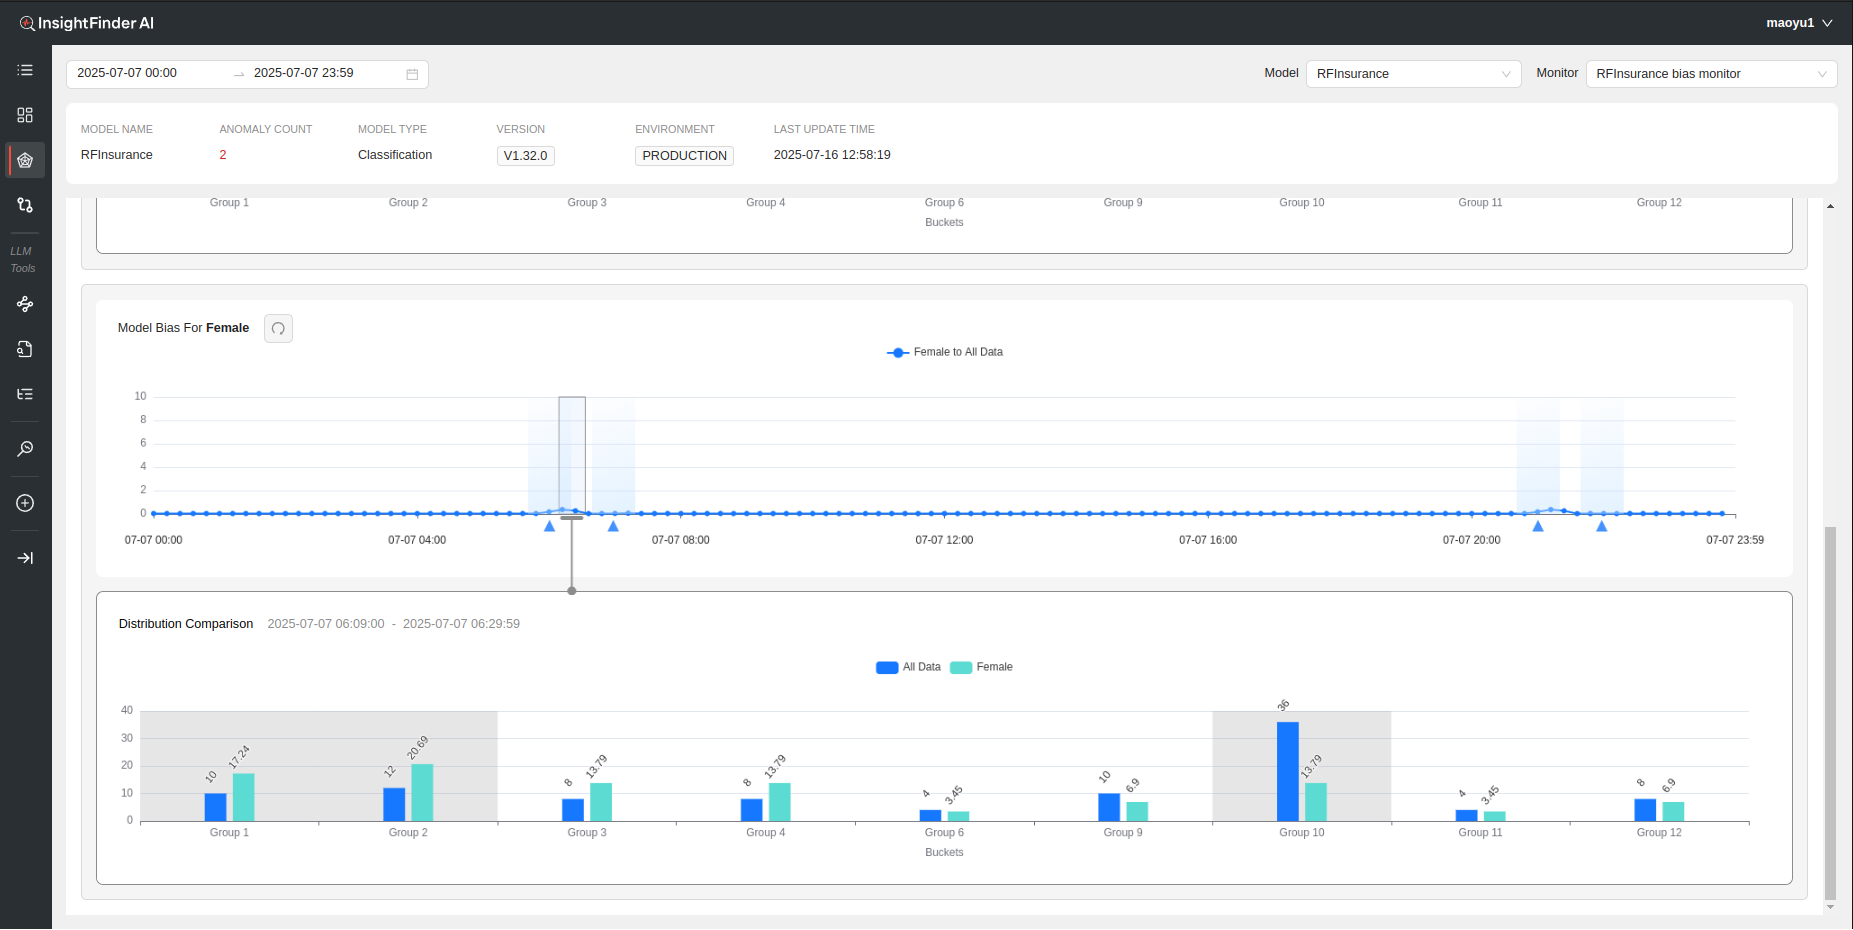
Based on the selections for ‘Group’, ‘Feature’ and ‘Metric’, and depending on how many buckets/categories the ‘Feature’ has, all the metrics and Distribution Comparisons for that Group and the respective Features will be displayed for analysis.
The Feature can either be categorical or numerical, but will need to define buckets during monitor creation if the feature is numerical. In the above example since ‘Sex’ is a binary categorical feature, the Workbench displays the selected distribution comparison metric (PSI in this case) and the bar charts for both Male and Female (possible values of sex) compared to the rest of the data.
Local SHAP
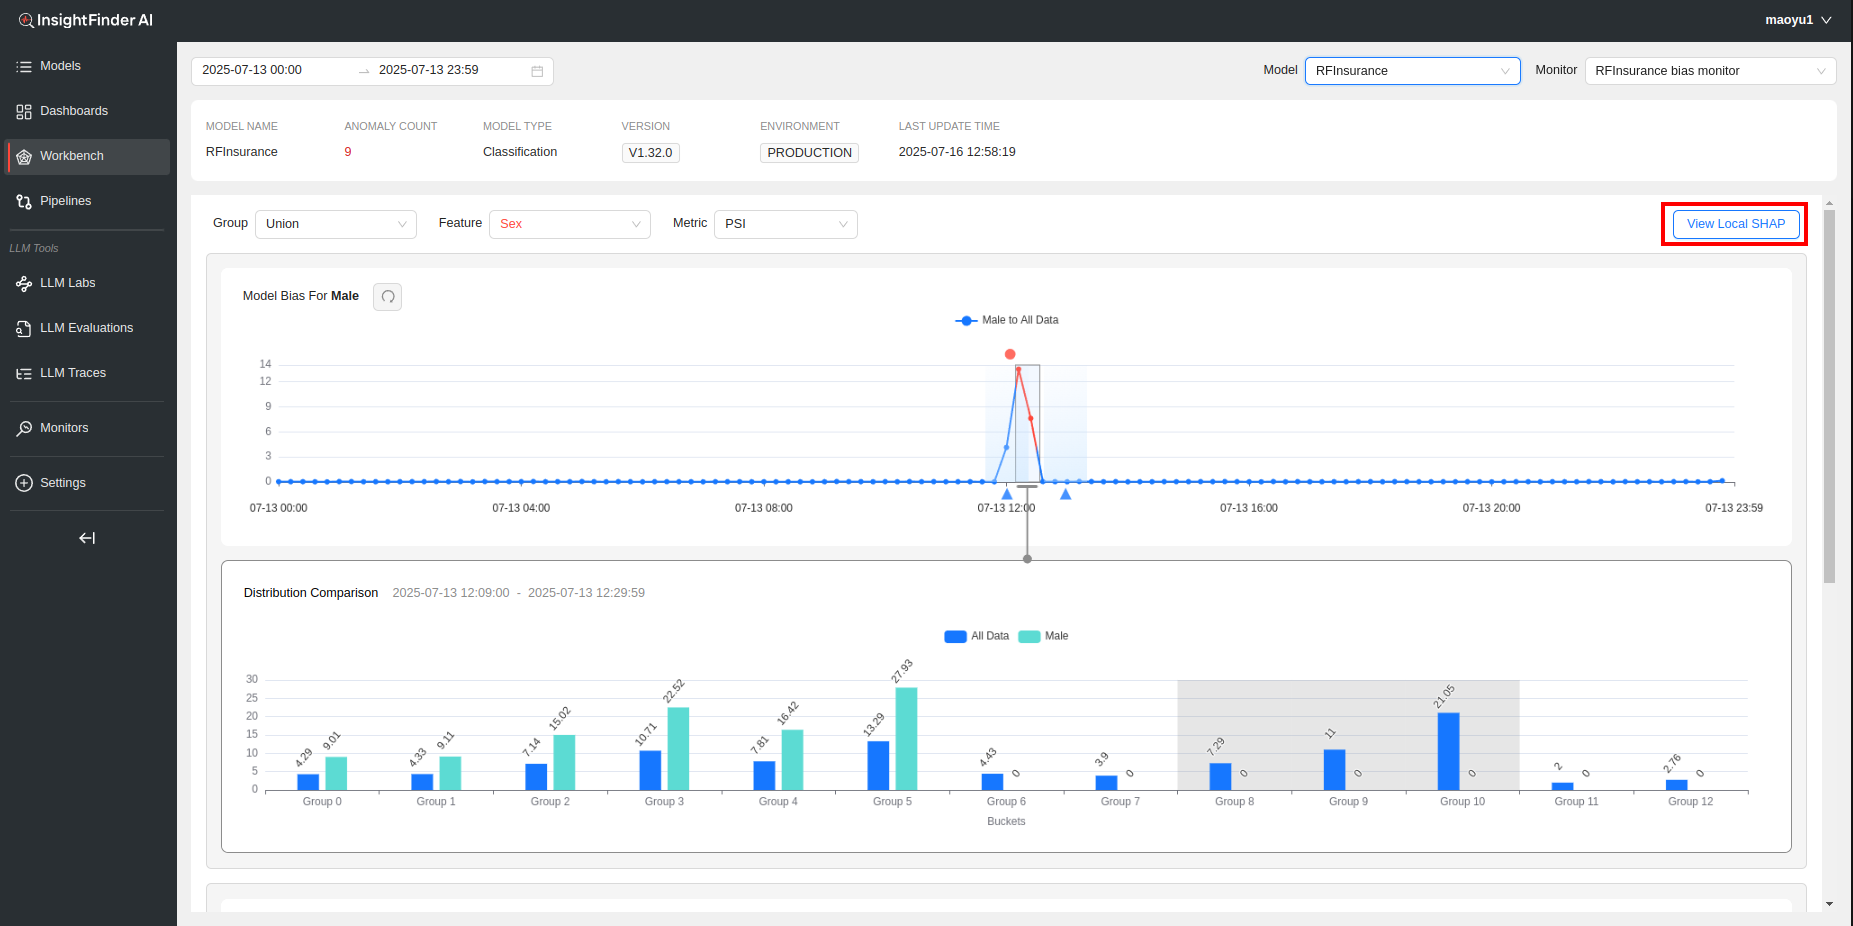
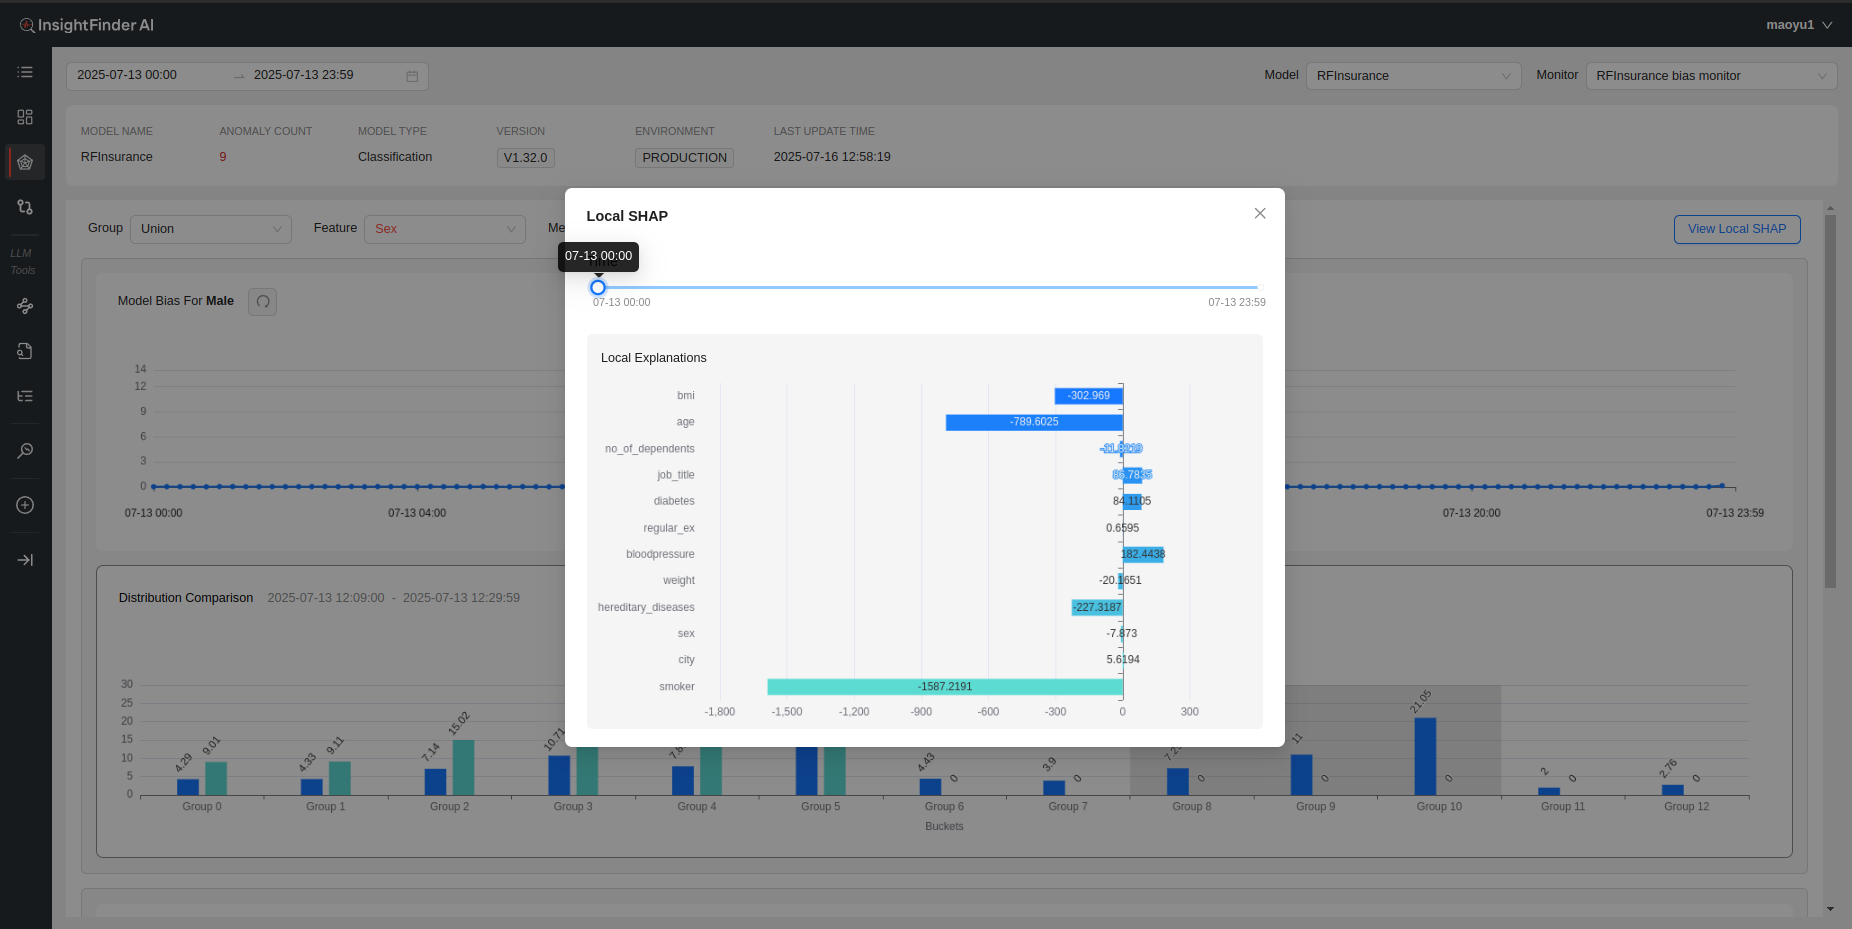
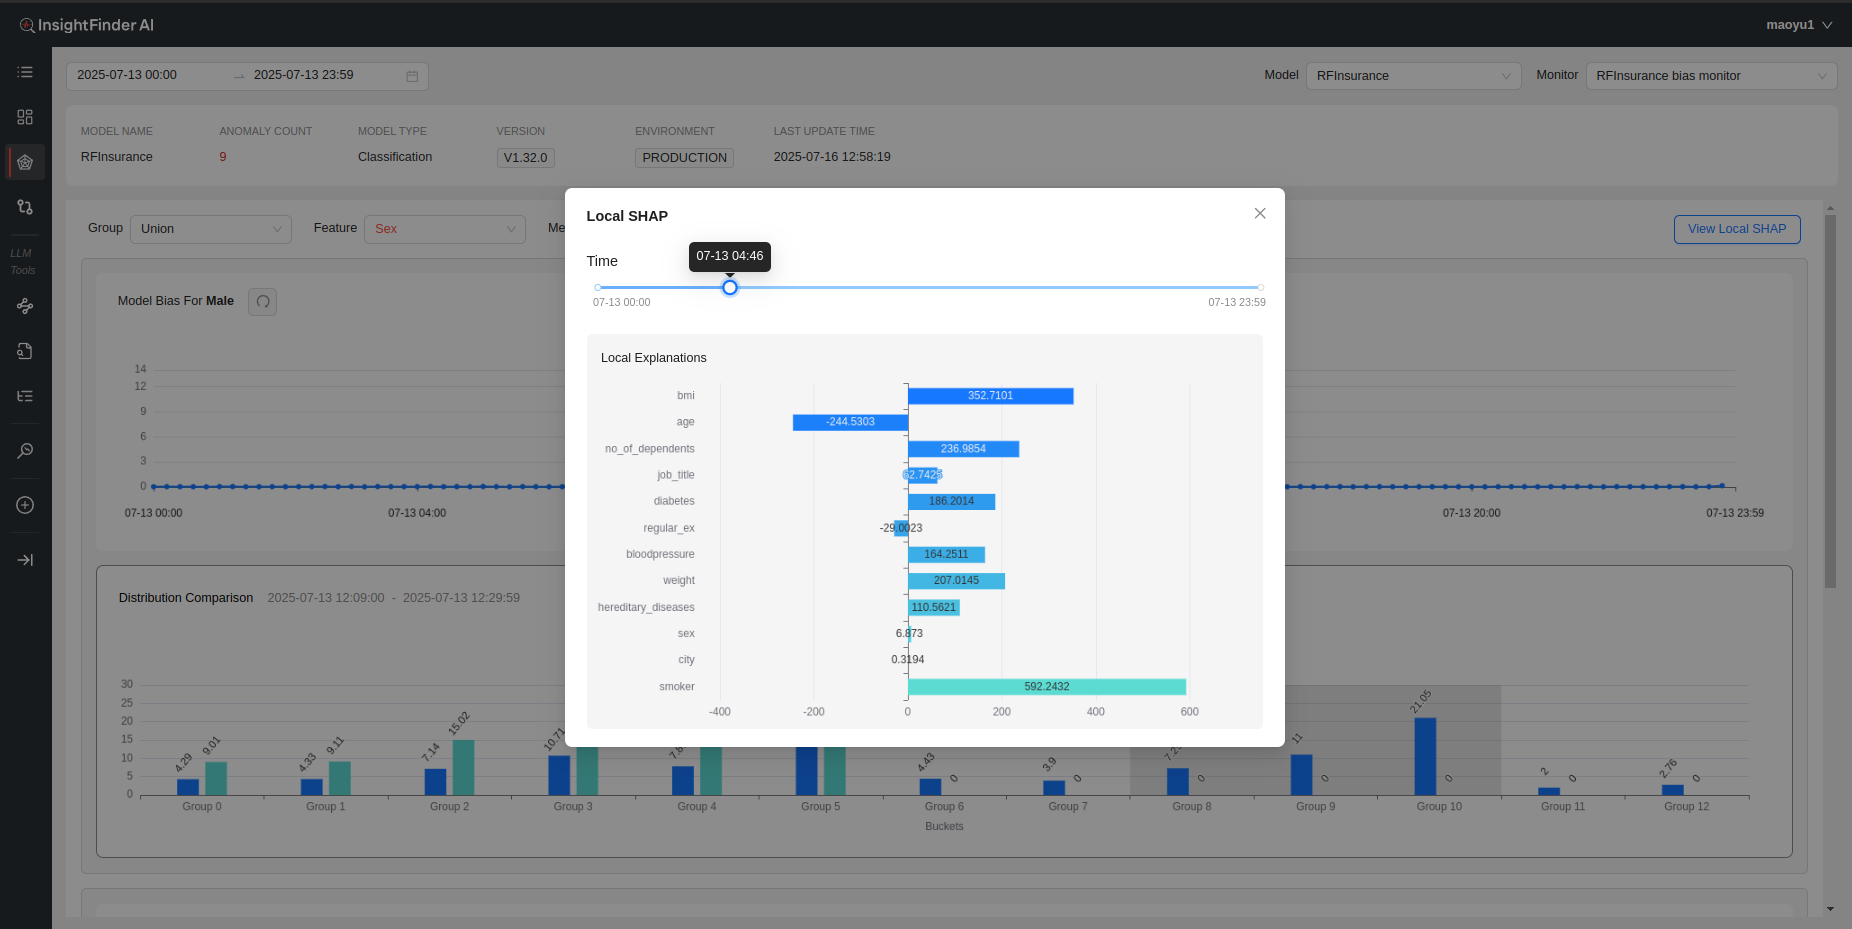
If local SHAP data is also being streamed into InsightFinder AI WatchTower, that data can be visually viewed here on the Model Bias Workbench Page by clicking on the ‘View Local SHAP’.
Once the Local SHAP data is loaded, users can drag the timestamp slider to the wanted timestamp to view the local SHAP data for the model in an easy to view display. The selectable time range is defined by the time range selection for the workbench page.
Data Quality
Data Quality Monitors detect the outliers, data gaps, consistency issues etc. to ensure data consistency and integrity across all data.
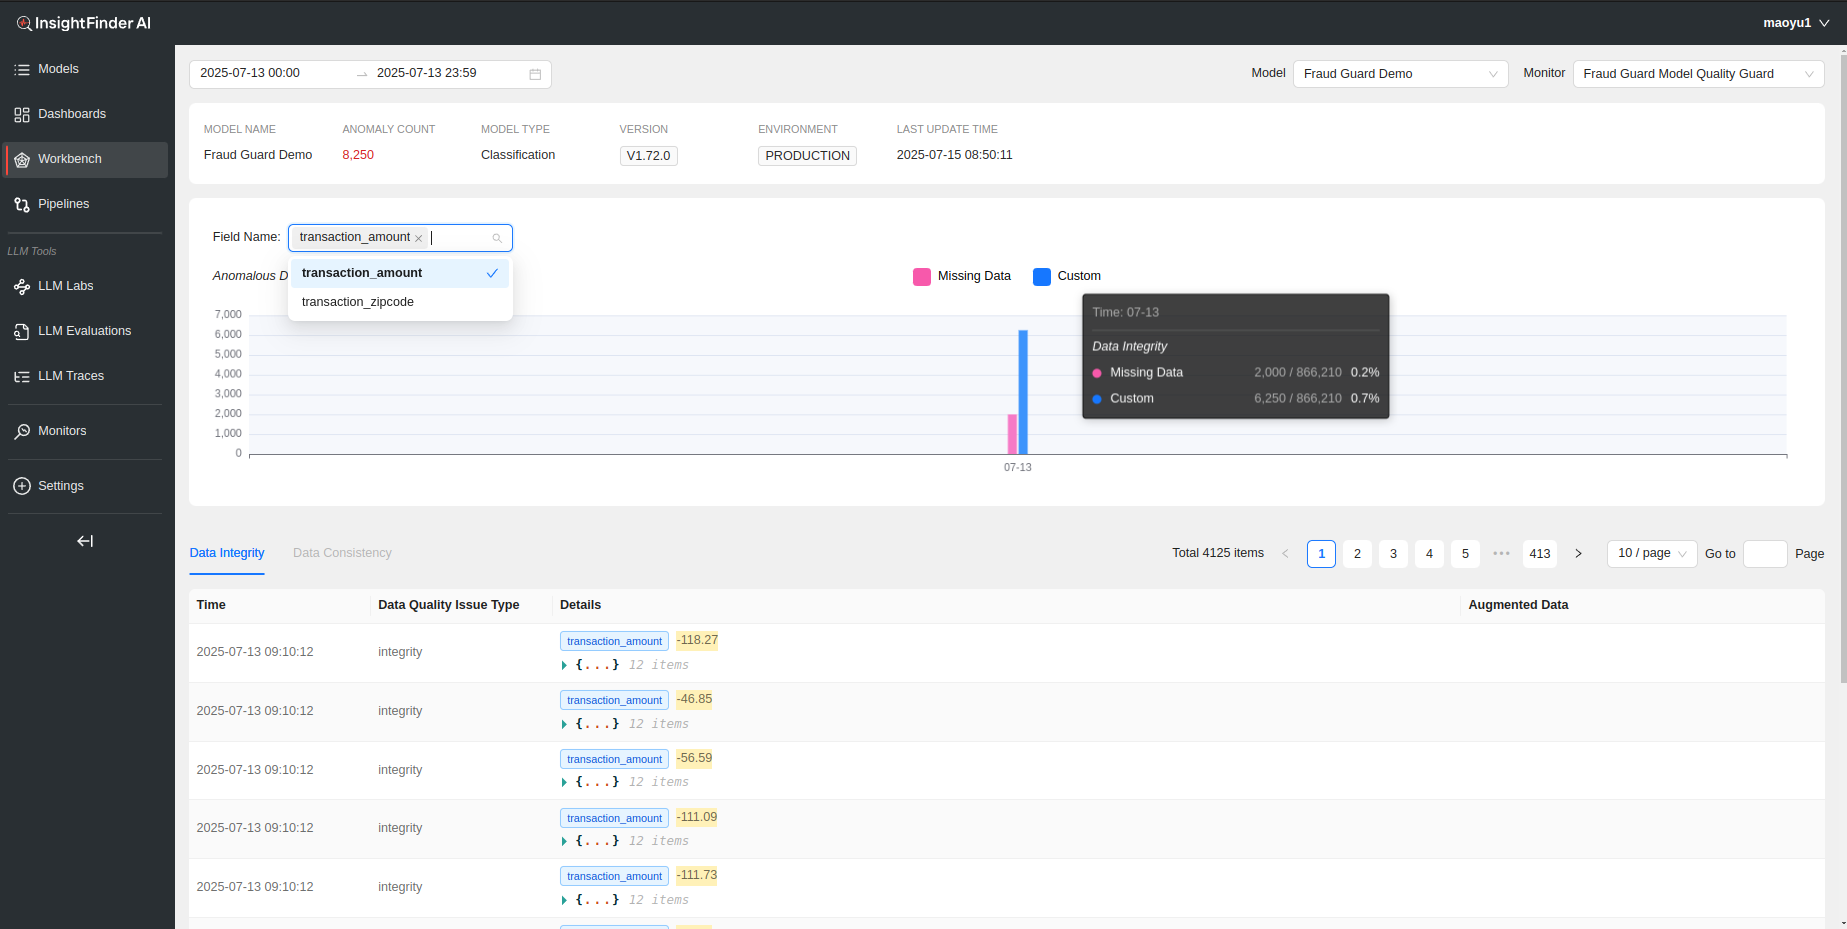
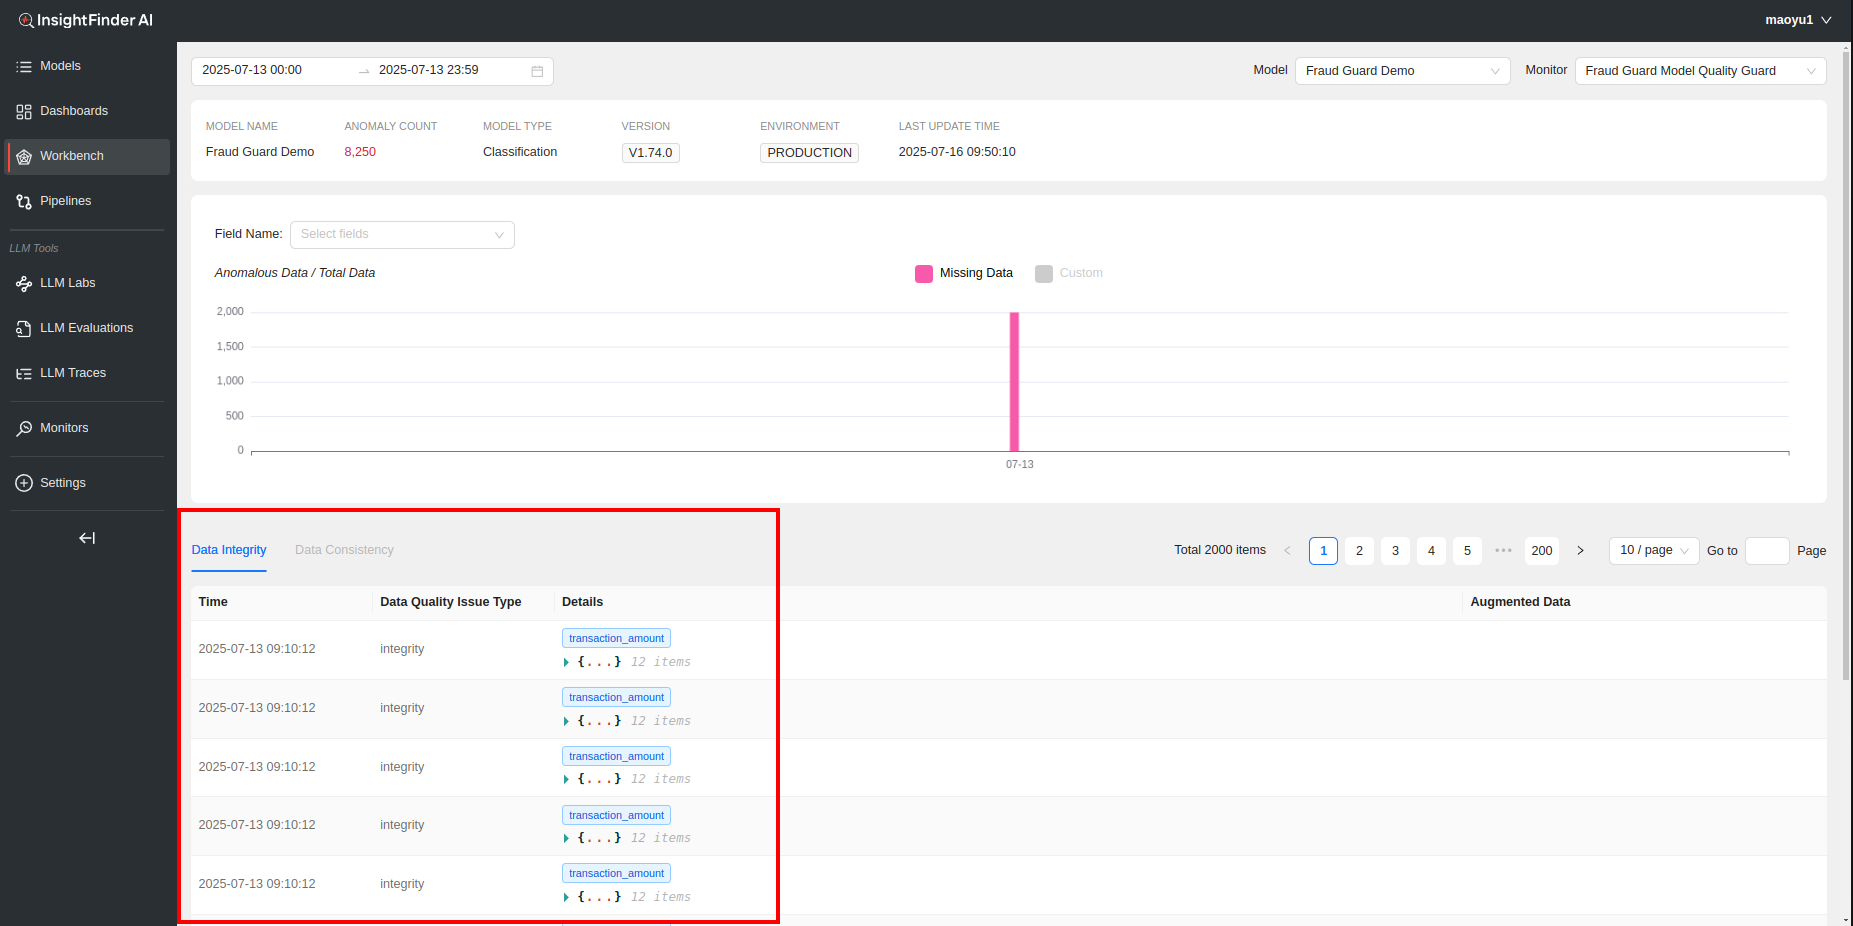
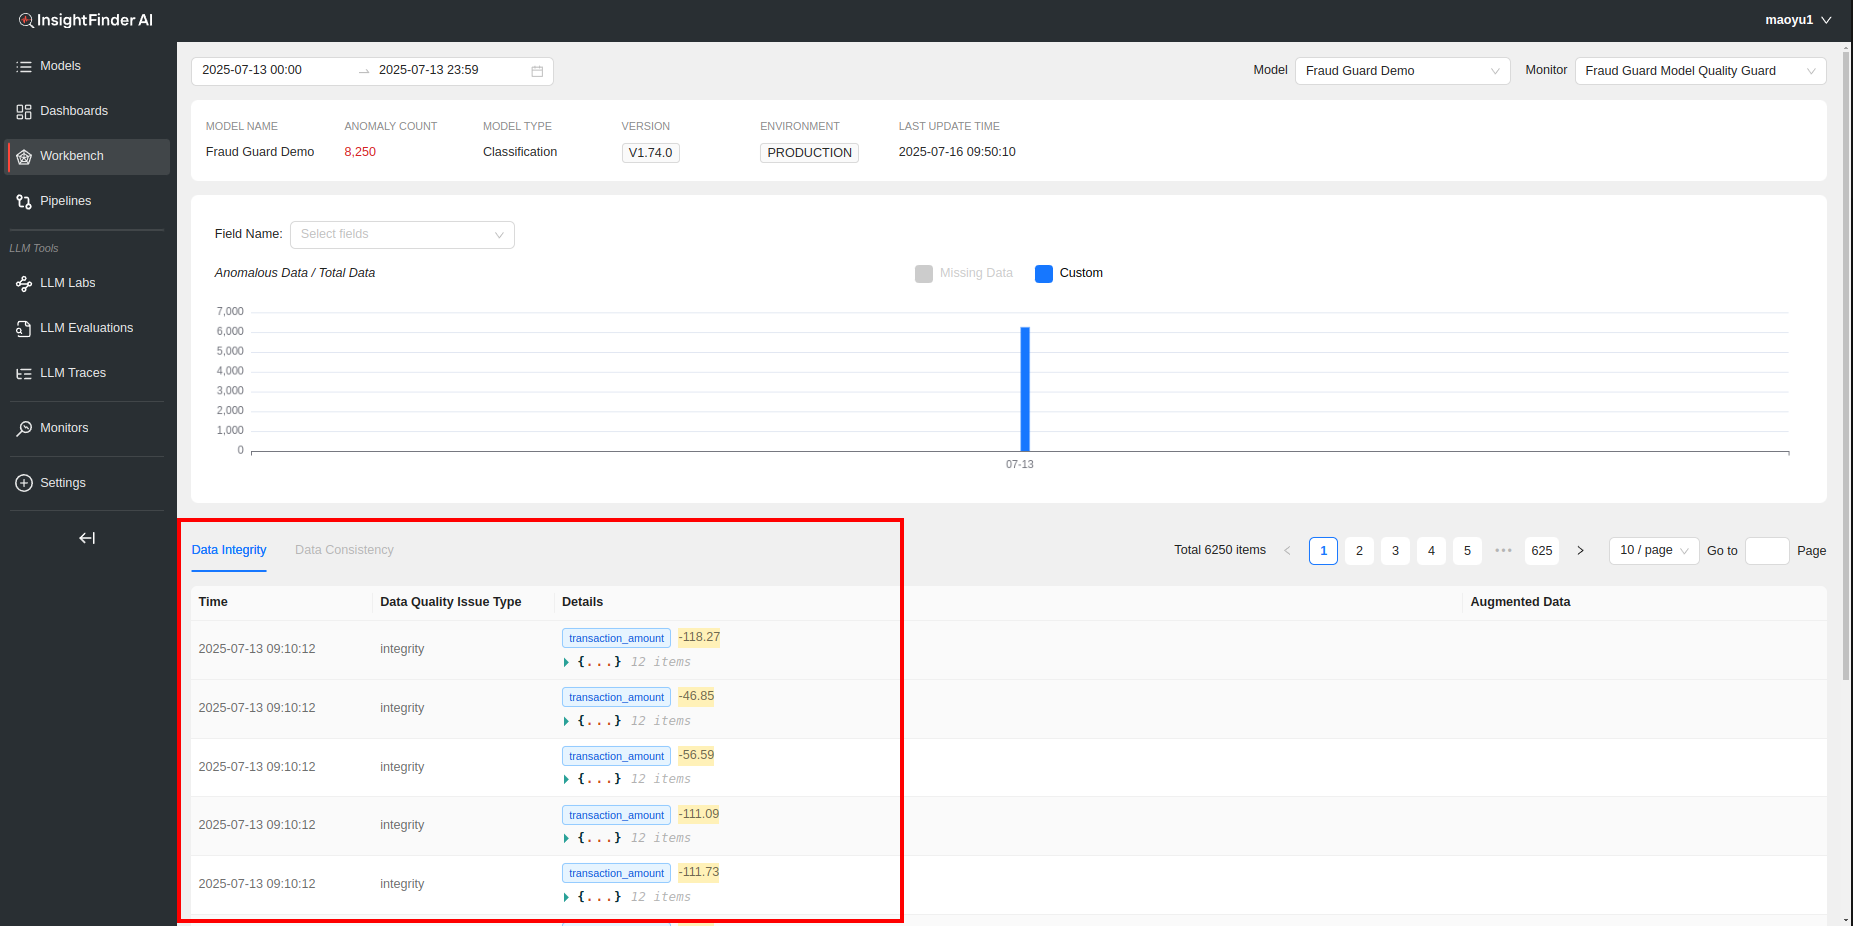
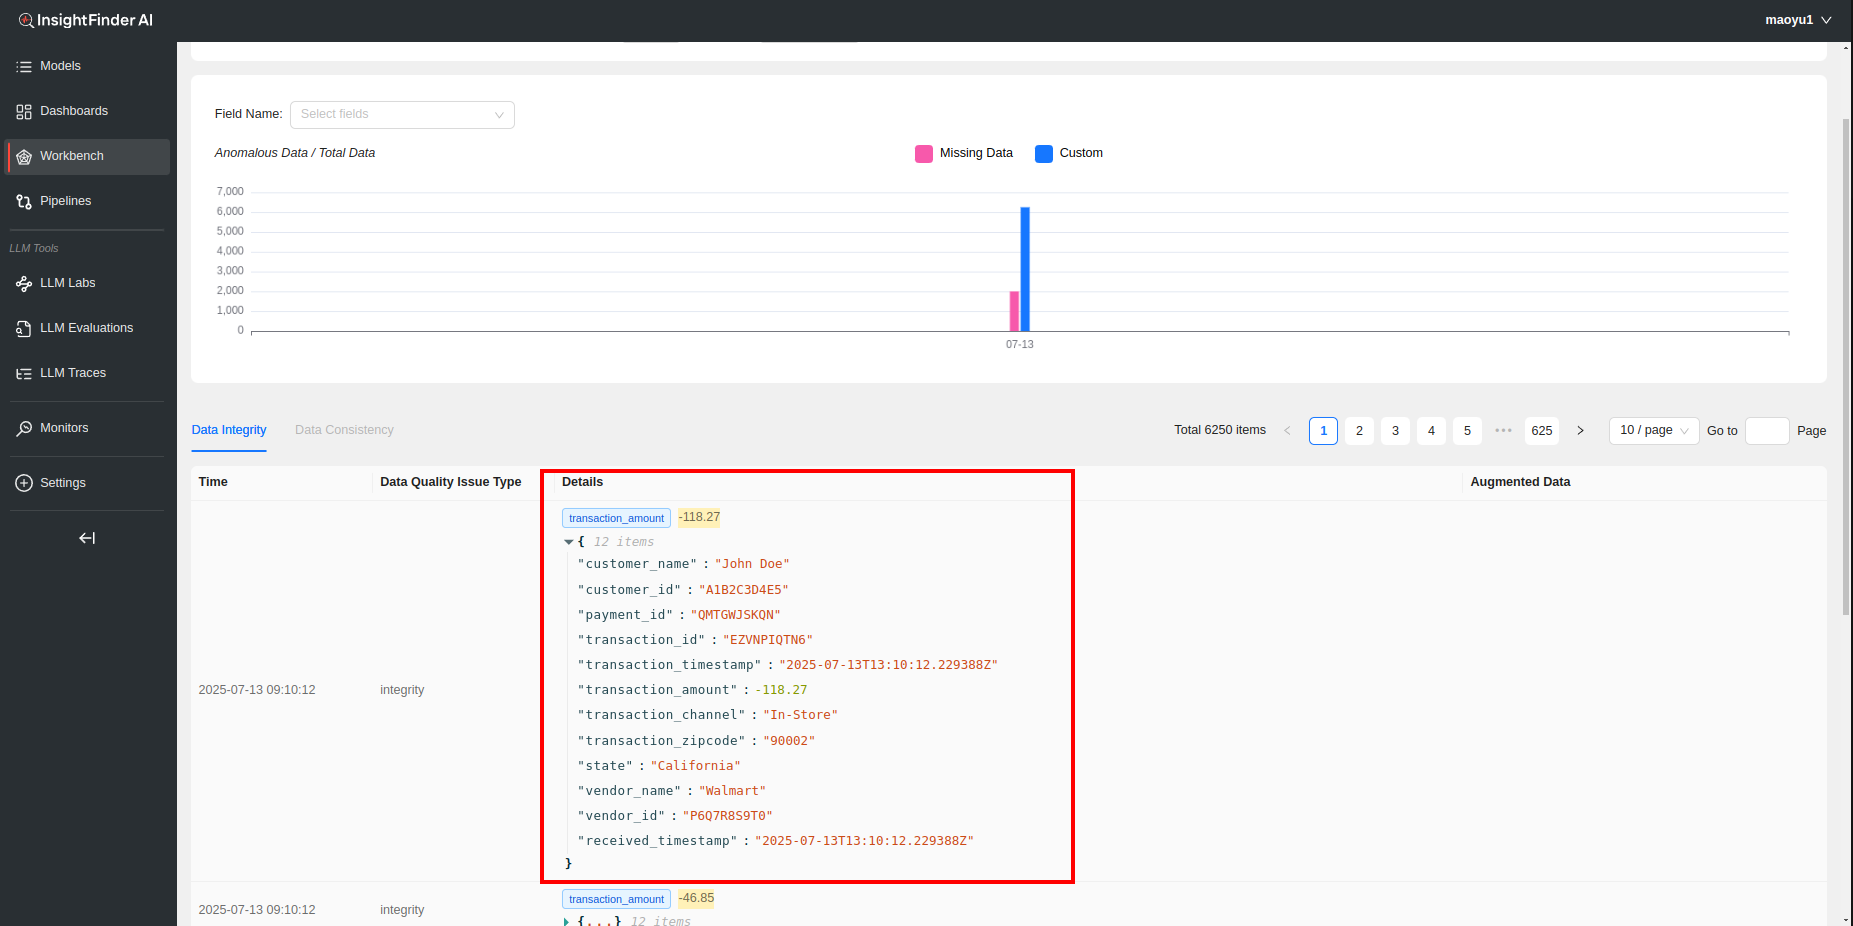
The Data Quality Workbench Page will show any of the detected data quality issues configured in the Data Quality Monitor, with percentages and count with respect to total data shown in the bar graphs based on the field name selection. By default if no field is selected, all data with data quality issues is displayed. The problematic logs are displayed below the graph, split between ‘Data Integrity’ and ‘Data Consistency’ issues, ordered by timestamp.
Clicking on the respective bar chart legends can isolate the data type to the issue wanted, making it easier to identify and navigate to a specific data issue. The log data available to view under Data Integrity and Data Consistency also changes based on the selection on the bar graphs.
The Log data in collapsed view shows the timestamp of the log, the problematic fields in the log (can be multiple), along with the respective value(s) of those fields that caused the log to be detected as a data quality issue. Each log can further be expanded to view the full log.
LLM Trust and Safety
The LLM Trust and Safety Monitor detects biased, toxic or malicious inputs and outputs for LLM Models, including prompt attacks, hallucinations and privacy violations.
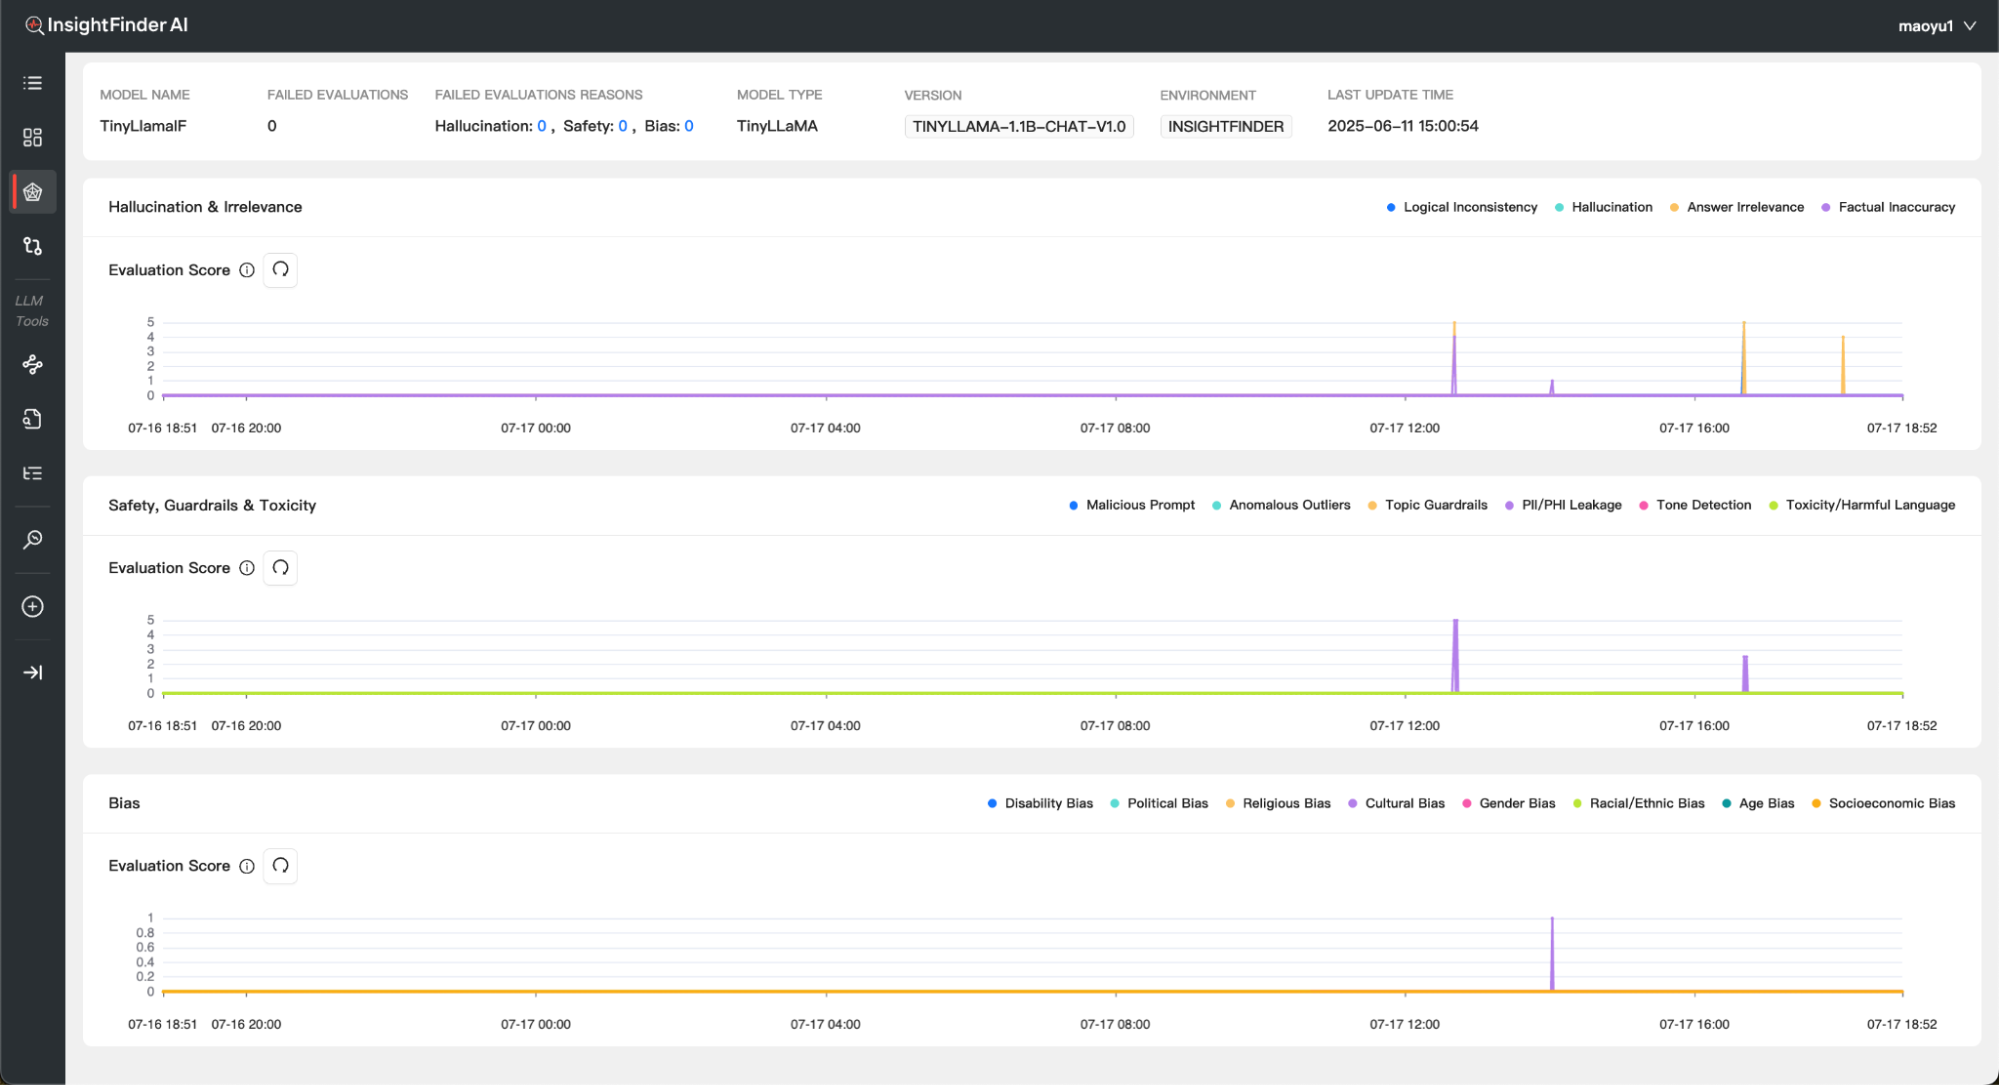
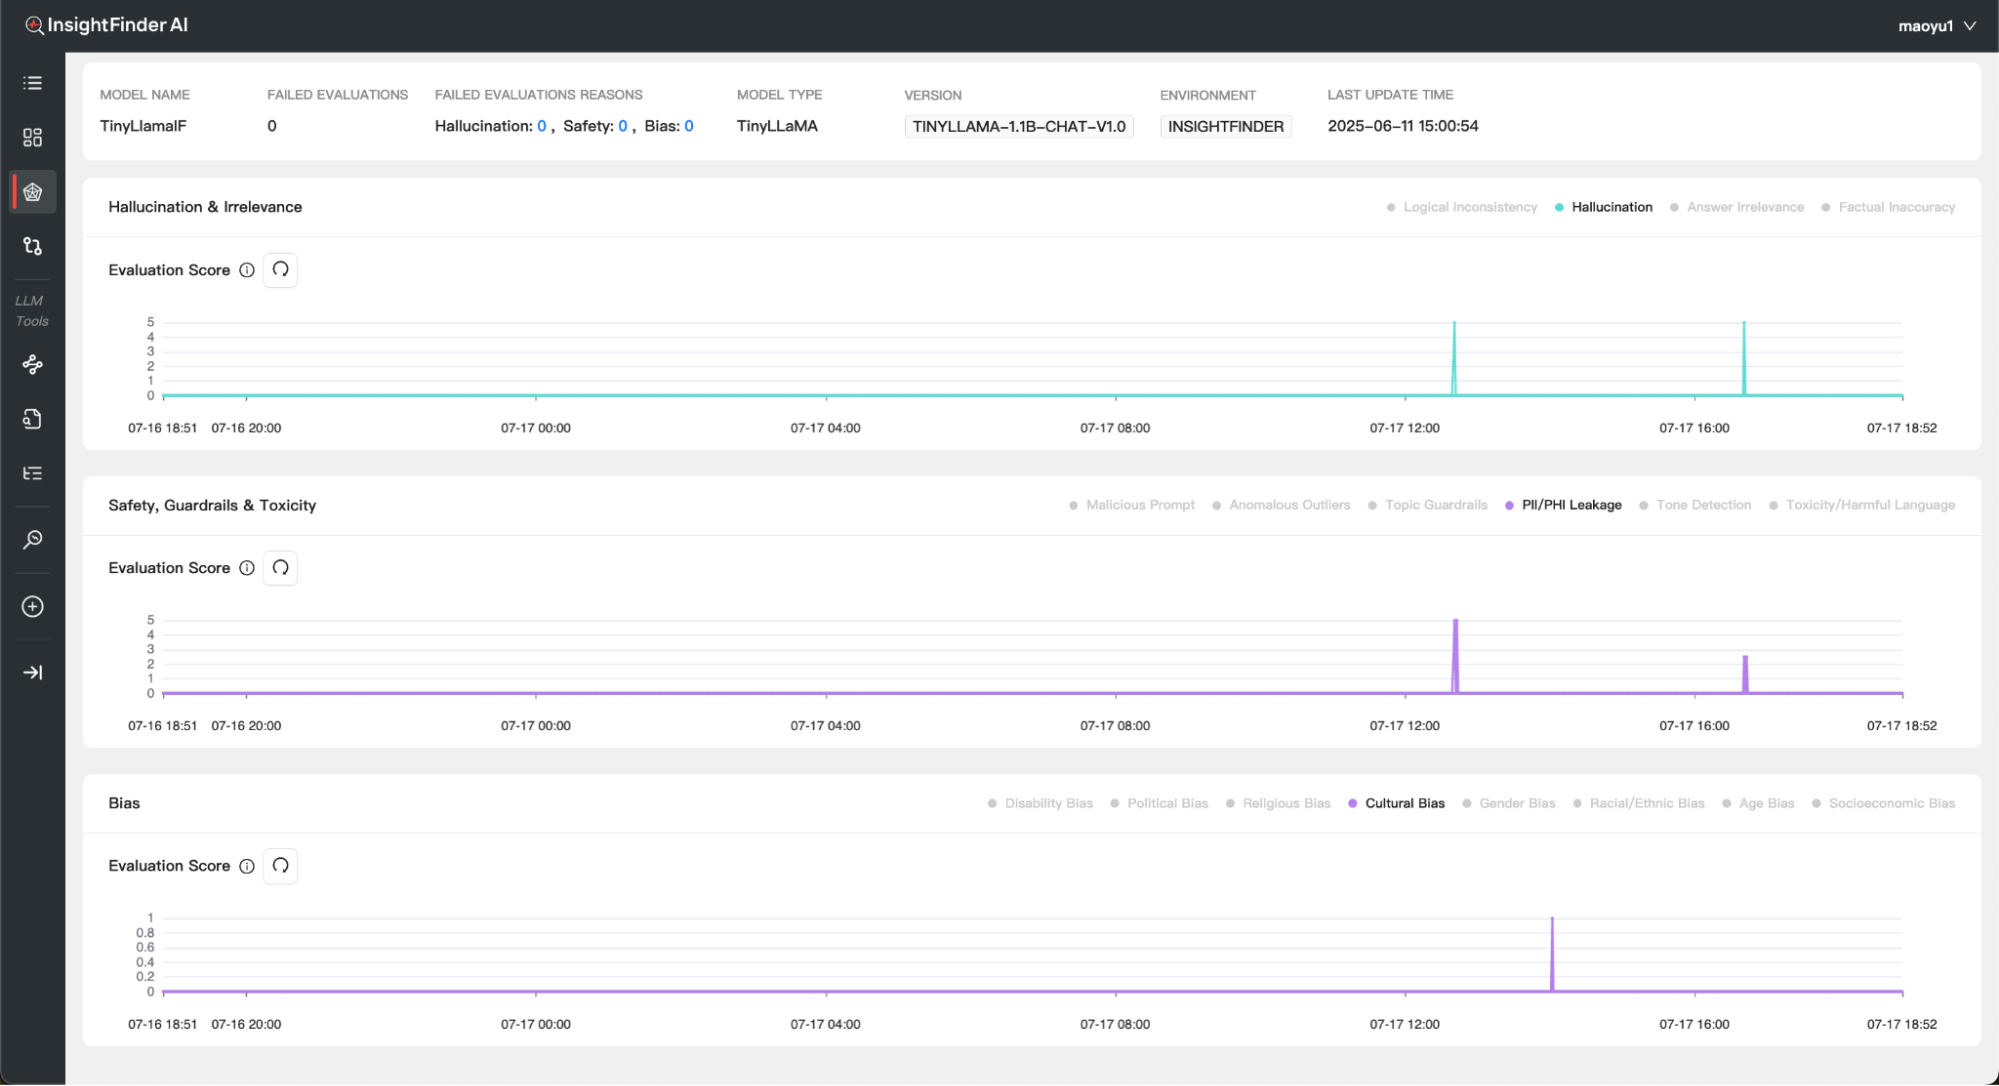
Depending on the options enabled in the monitor, the workbench page for LLM Trust and Safety can have line charts for Hallucination & Irrelevance, Safety, Guardrails & Toxicity and Bias. Each line on the chart is a specific issue type (example Toxic Language, Malicious Prompt etc.)
Each Issue type can be isolated if wanted by clicking on its respective legend. The higher the evaluation score, the worse the issue.
LLM Performance
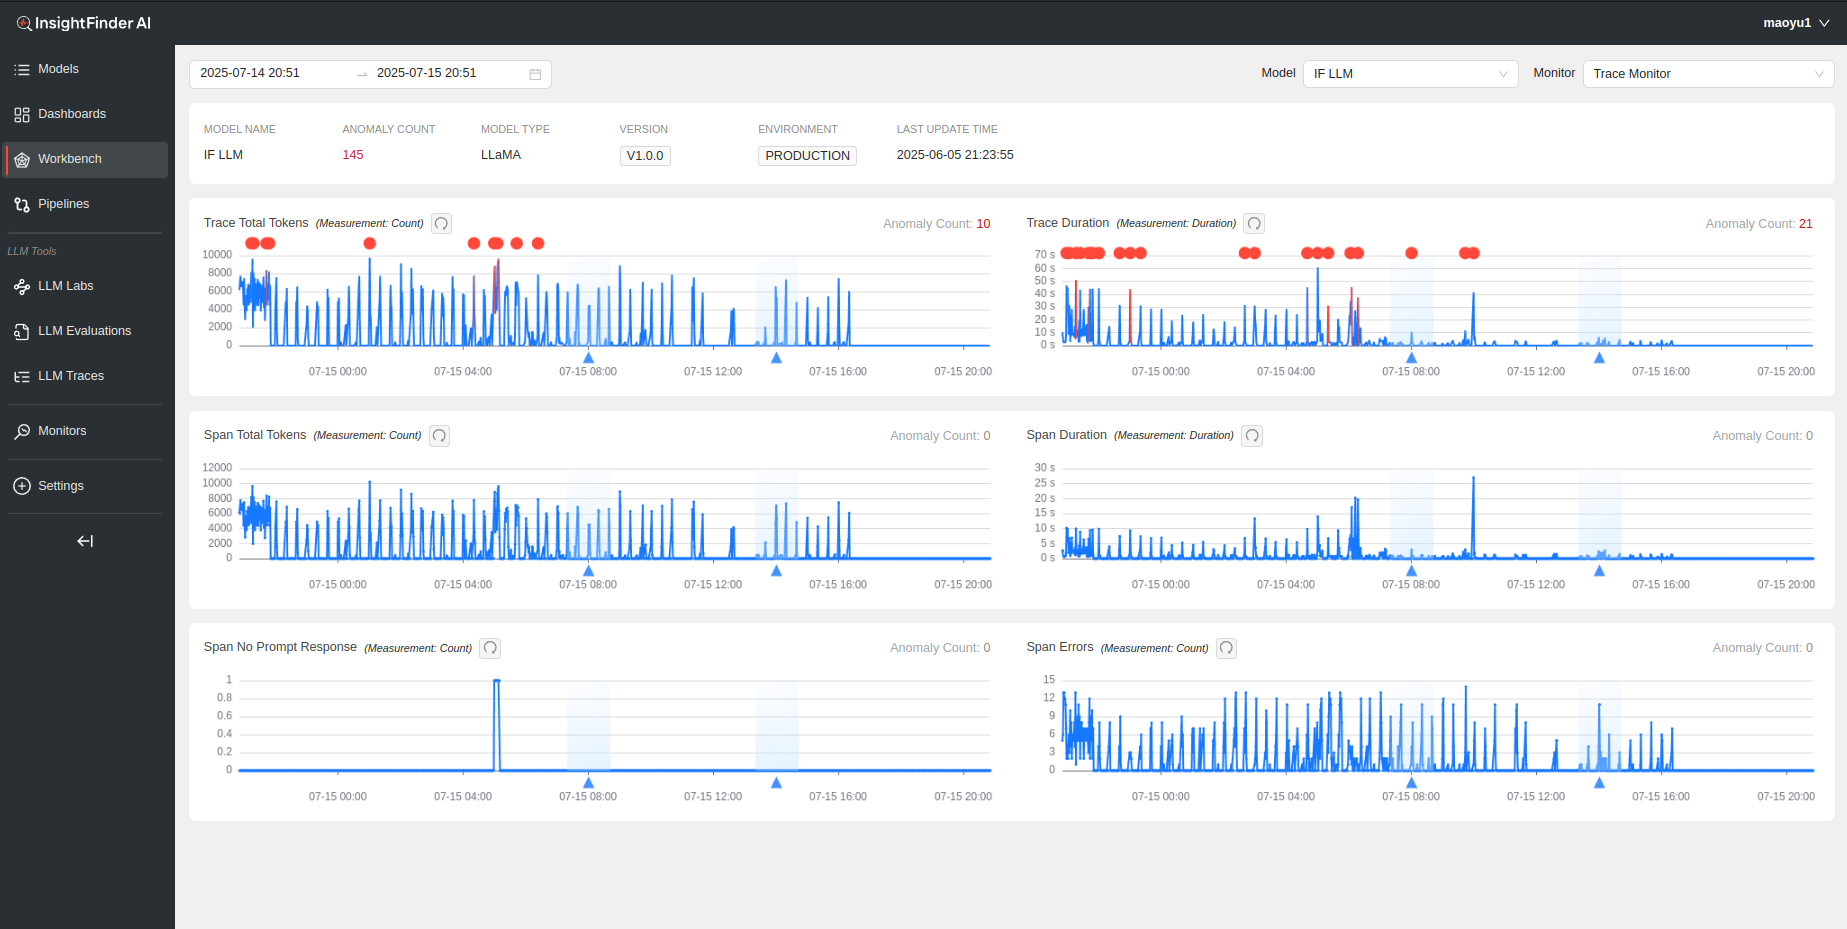
LLM Performance Monitor detects response time issues with spans and traces, spans with errors and missing responses.
Depending on the options selected in the Monitor, InsightFinder will automatically identify issues with traces and spans, convert them to their respective metrics values to view on the LLM Performance Workbench page for the Model
From the Blog
See how InsightFinder helps your team deliver reliable services across every layer of the stack
Take InsightFinder AI for a no-obligation test drive. We’ll provide you with a detailed report on your outages to uncover what could have been prevented.


